Cara membuat grafik candlestick menggunakan matplotlib dengan python
Grafik candlestick adalah jenis grafik keuangan yang menampilkan pergerakan harga sekuritas dari waktu ke waktu.
Contoh berikut menunjukkan cara membuat grafik candlestick menggunakan pustaka visualisasi Matplotlib dengan Python.
Contoh: Membuat Grafik Candlestick dengan Python
Katakanlah kita memiliki pandas DataFrame berikut yang menunjukkan harga pembukaan, penutupan, tertinggi dan terendah dari suatu saham tertentu selama periode 8 hari:
 import pandas as pd

#createDataFrame
prices = pd. DataFrame ({' open ': [25, 22, 21, 19, 23, 21, 25, 29],
                       ' close ': [24, 20, 17, 23, 22, 25, 29, 31],
                       ' high ': [28, 27, 29, 25, 24, 26, 31, 37],
                       ' low ': [22, 16, 14, 17, 19, 18, 22, 26]},
                       index=pd. date_range (" 2021-01-01 ", periods=8, freq=" d "))

#display DataFrame
print (prices)

            open close high low
2021-01-01 25 24 28 22
2021-01-02 22 20 27 16
2021-01-03 21 17 29 14
2021-01-04 19 23 25 17
2021-01-05 23 22 24 19
2021-01-06 21 25 26 18
2021-01-07 25 29 31 22
2021-01-08 29 31 37 26
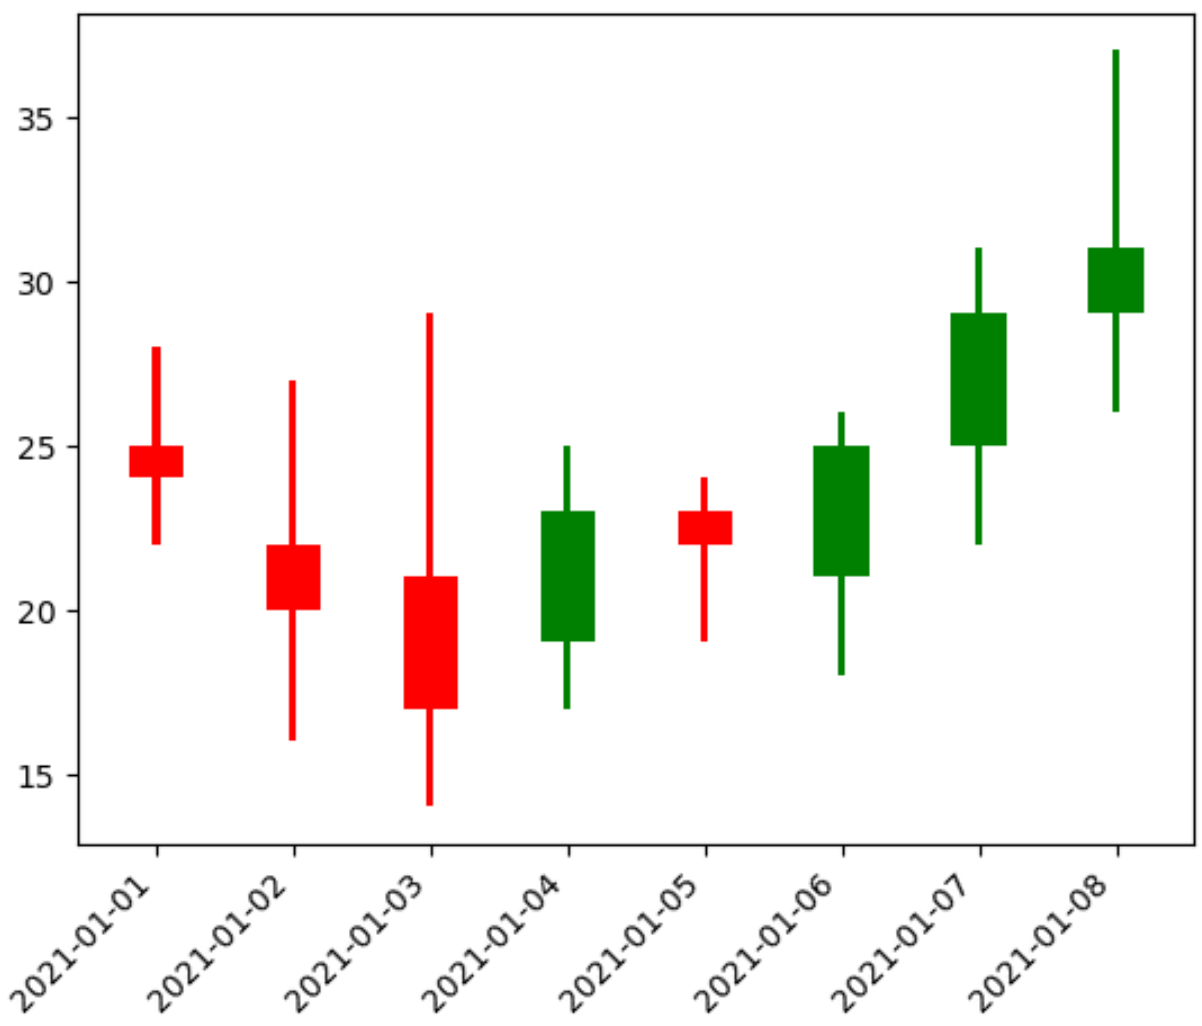
Kita dapat menggunakan kode berikut untuk membuat grafik candlestick untuk memvisualisasikan pergerakan harga saham ini selama periode 8 hari ini:
 import matplotlib. pyplot as plt

#create figure
plt. figure ()

#define width of candlestick elements
width = .4
width2 = .05

#define up and down prices
up = prices[prices. close >=prices. open ]
down = prices[prices. close <prices. open ]

#define colors to use
col1 = ' green '
col2 = ' red '

#plot up prices
plt. bar (up. index , up. close -up. open , width, bottom=up. open , color=col1)
plt. bar (up. index ,up. high -up. close ,width2,bottom=up. close ,color=col1)
plt. bar (up. index , up. low -up. open , width2, bottom=up. open , color=col1)

#plot down prices
plt. bar (down. index , down. close -down. open , width, bottom=down. open , color=col2)
plt. bar (down. index , down. high -down. open , width2, bottom=down. open , color=col2)
plt. bar (down. index ,down. low -down. close ,width2,bottom=down. close ,color=col2)

#rotate x-axis tick labels
plt. xticks (rotation= 45 , ha=' right ')

#display candlestick chart
plt. show ()

Setiap kandil mewakili perubahan harga sekuritas pada hari tertentu. Warna kandil memberi tahu kita apakah harga ditutup lebih tinggi (hijau) atau lebih rendah (merah) dibandingkan hari sebelumnya.
Jangan ragu untuk mengubah lebar kandil dan warna yang digunakan untuk membuat grafik tampak sesuai keinginan Anda.
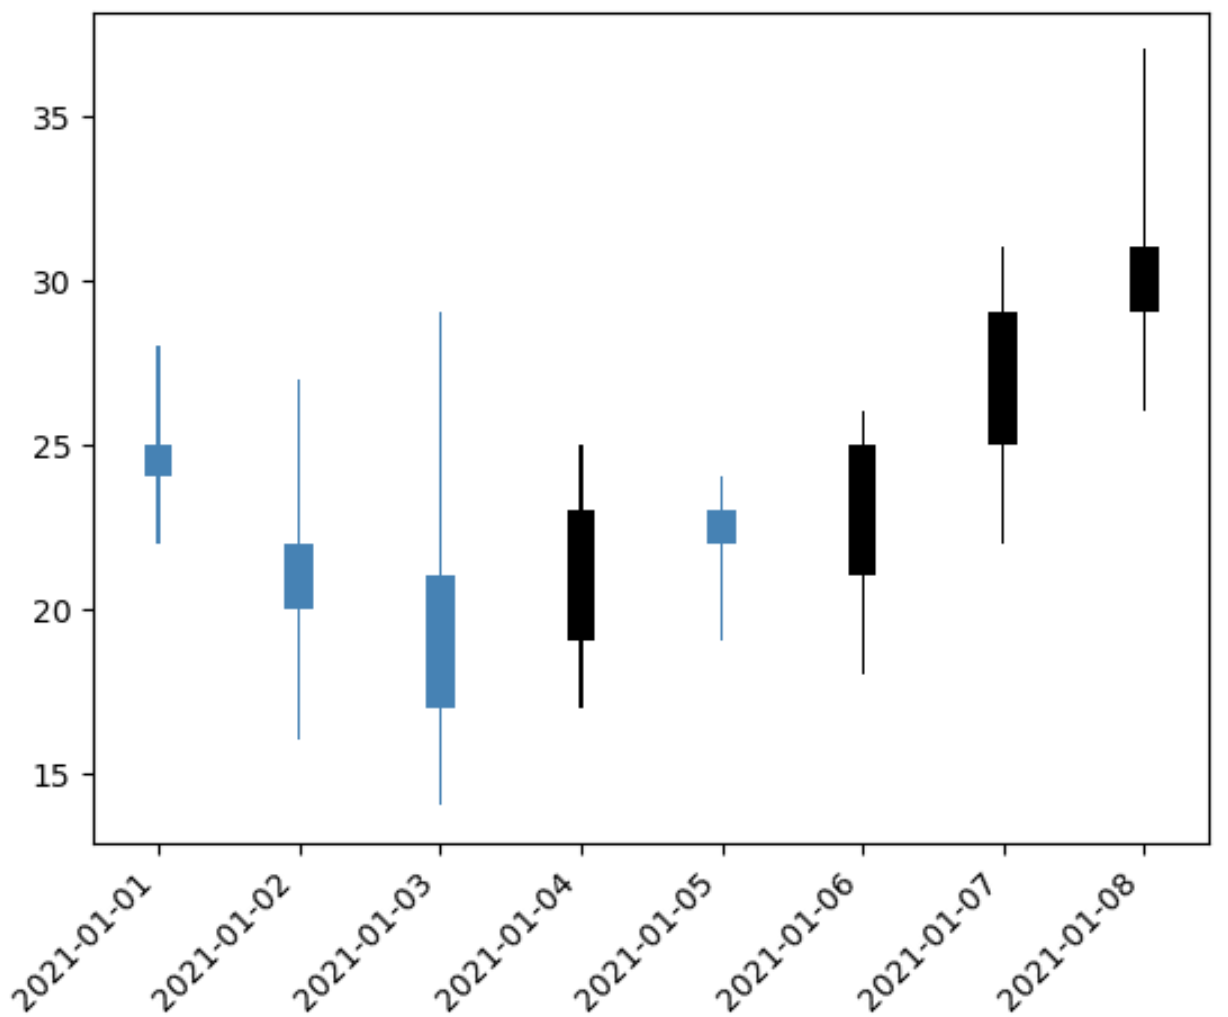
Misalnya, kita dapat membuat lilin lebih tipis lagi dan menggunakan warna berbeda untuk mewakili hari “tinggi” dan “rendah”:
 import matplotlib. pyplot as plt

#create figure
plt. figure ()

#define width of candlestick elements
width = .2
width2 = .02

#define up and down prices
up = prices[prices. close >=prices. open ]
down = prices[prices. close <prices. open ]

#define colors to use
col1 = ' black '
col2 = ' steelblue '

#plot up prices
plt. bar (up. index , up. close -up. open , width, bottom=up. open , color=col1)
plt. bar (up. index ,up. high -up. close ,width2,bottom=up. close ,color=col1)
plt. bar (up. index , up. low -up. open , width2, bottom=up. open , color=col1)

#plot down prices
plt. bar (down. index , down. close -down. open , width, bottom=down. open , color=col2)
plt. bar (down. index , down. high -down. open , width2, bottom=down. open , color=col2)
plt. bar (down. index ,down. low -down. close ,width2,bottom=down. close ,color=col2)

#rotate x-axis tick labels
plt. xticks (rotation= 45 , ha=' right ')

#display candlestick chart
plt. show ()

Sumber daya tambahan
Tutorial berikut menjelaskan cara membuat grafik umum lainnya dengan Python:
Cara membuat beberapa plot Matplotlib pada satu gambar
Cara memplot histogram dari daftar data dengan Python
Cara Membuat Plot Kotak berdasarkan Grup dengan Python