Cara menggambar garis vertikal di matplotlib (dengan contoh)
Anda dapat menggunakan sintaks berikut untuk memplot garis vertikal di Matplotlib:
 import matplotlib. pyplot as plt

#draw vertical line at x=2
plt. axvline (x=2)
Contoh berikut menunjukkan cara menggunakan sintaksis ini dalam praktiknya dengan pandas DataFrame berikut:
 import pandas as pd

#createDataFrame
df = pd. DataFrame ({' x ': [1, 2, 3, 4, 5, 6, 7, 8],
                   ' y ': [5, 7, 8, 15, 26, 39, 45, 40]})

#view DataFrame
df

	x y
0 1 5
1 2 7
2 3 8
3 4 15
4 5 26
5 6 39
6 7 45
7 8 40
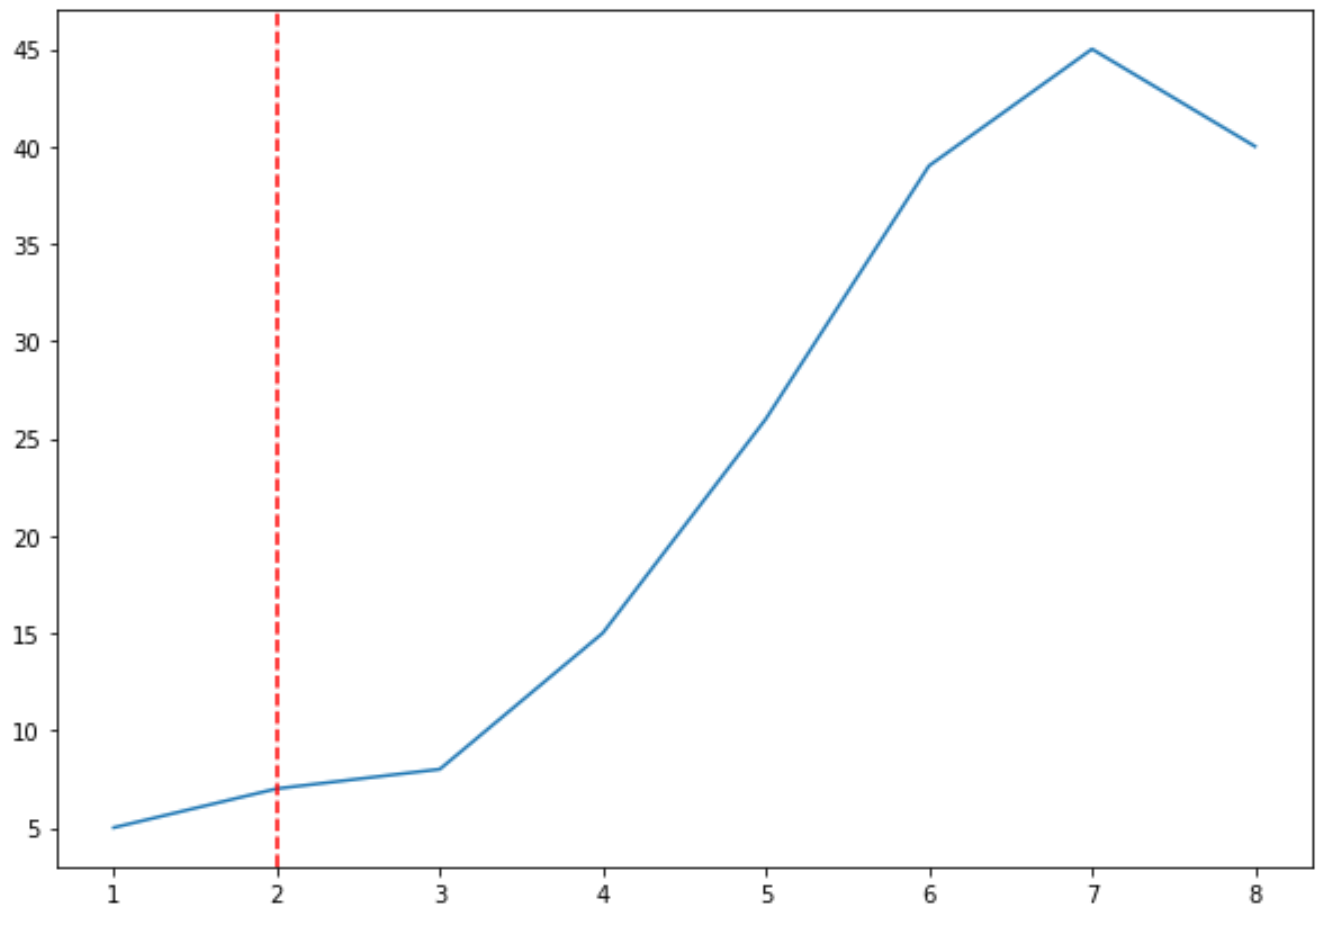
Contoh 1: Menggambar Garis Vertikal
Kode berikut menunjukkan cara menggambar garis vertikal pada plot Matplotlib:
 import matplotlib. pyplot as plt

#create line plot
plt. plot (df. x , df. y )

#add vertical line at x=2
plt. axvline (x=2, color=' red ', linestyle=' -- ')
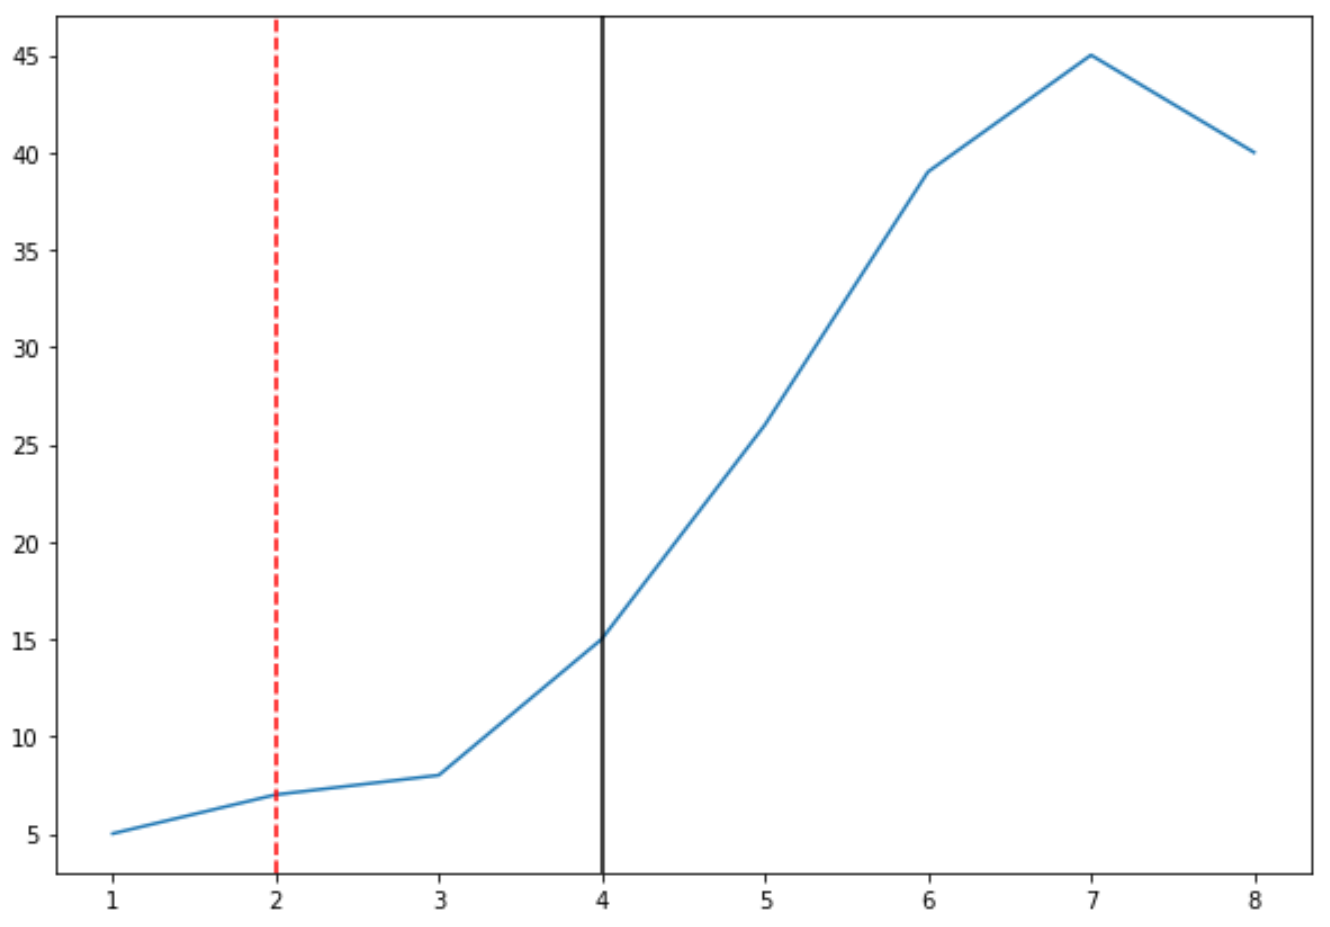
Contoh 2: menggambar beberapa garis vertikal
Kode berikut menunjukkan cara menggambar beberapa garis vertikal pada plot Matplotlib:
 import matplotlib. pyplot as plt

#create line plot
plt. plot (df. x , df. y )

#add vertical line at x=2
plt. axvline (x=2, color=' red ', linestyle=' -- ')

#add vertical line at x=4
plt. axvline (x=4, color=' black ', linestyle=' - ')
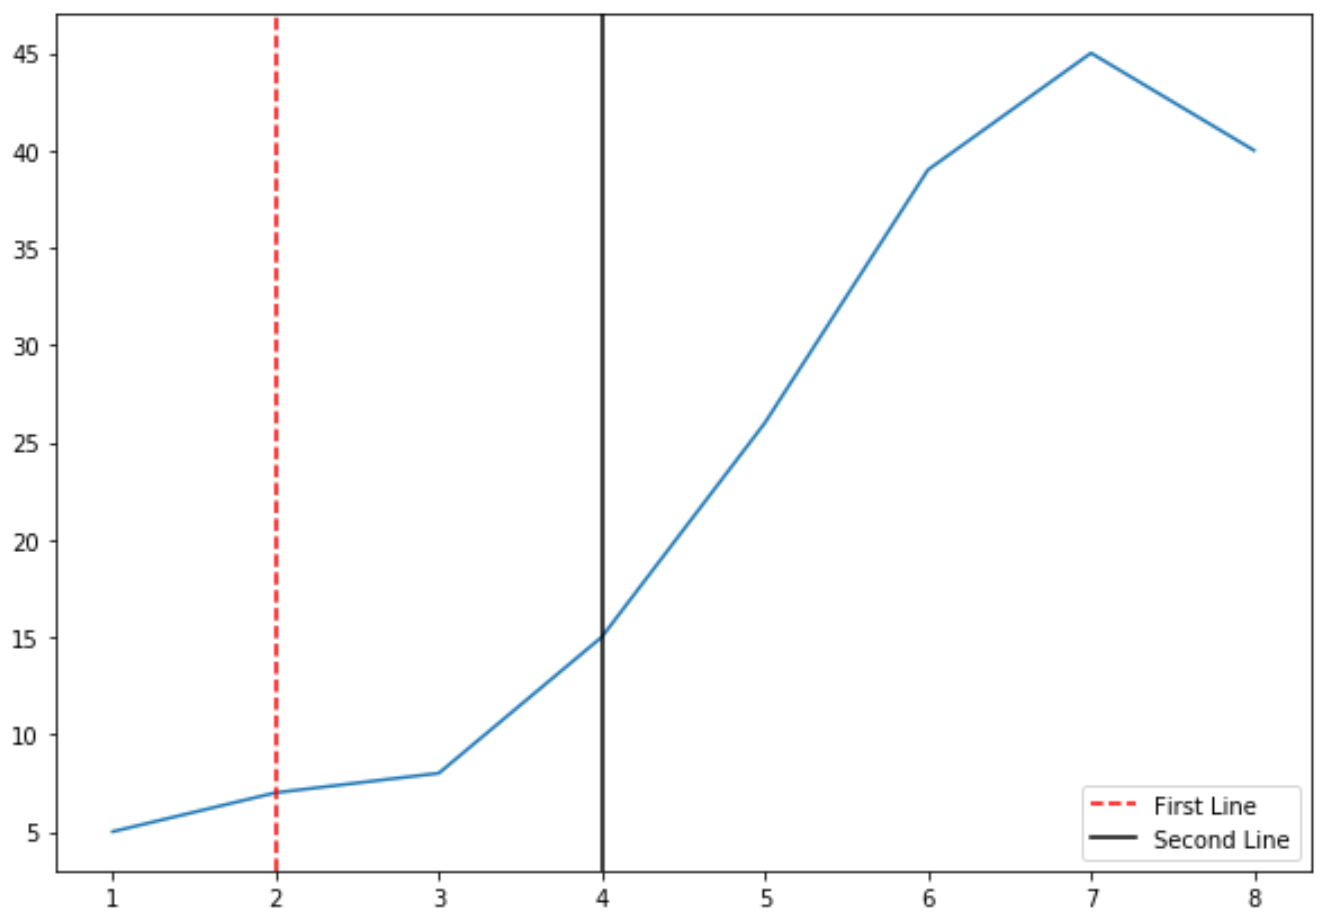
Contoh 3: Gambarlah beberapa garis vertikal dengan legenda
Kode berikut menunjukkan cara menggambar beberapa garis vertikal pada plot Matplotlib dan menambahkan legenda untuk membuat garis lebih mudah diinterpretasikan:
 import matplotlib. pyplot as plt

#create line plot
plt. plot (df. x , df. y )

#add vertical line at x=2
plt. axvline (x=2, color=' red ', linestyle=' -- ', label=' First Line ')

#add vertical line at x=4
plt. axvline (x=4, color=' black ', linestyle=' - ', label=' Second Line ')

#add legend
plt. legend ()
Catatan: Lihat dokumentasi Matplotlib untuk daftar kemungkinan warna dan gaya garis yang dapat Anda terapkan pada garis vertikal.
Sumber daya tambahan
Cara menggambar garis horizontal di Matplotlib
Cara memplot banyak baris di Matplotlib
Cara memplot deret waktu di Matplotlib
Cara menggambar persegi panjang di Matplotlib
Cara menggambar panah di Matplotlib
Tentang Penulis
Benjamin anderson
Halo, saya Benjamin, pensiunan profesor statistika yang menjadi guru Statorial yang berdedikasi. Dengan pengalaman dan keahlian yang luas di bidang statistika, saya ingin berbagi ilmu untuk memberdayakan mahasiswa melalui Statorials. Baca selengkapnya