Cara menambahkan teks ke plot matplotlib (dengan contoh)
Anda dapat dengan mudah menambahkan teks ke plot Matplotlib menggunakan fungsi matplotlib.pyplot.text() , yang menggunakan sintaks berikut:
matplotlib.pyplot.text(x, y, s, fontdict=Tidak Ada)
Emas:
- x: Koordinat x teks
- y: Koordinat y teks
- s: string teks
- fontdict: kamus untuk mengganti properti teks default
Tutorial ini menunjukkan beberapa contoh penggunaan praktis fungsi ini.
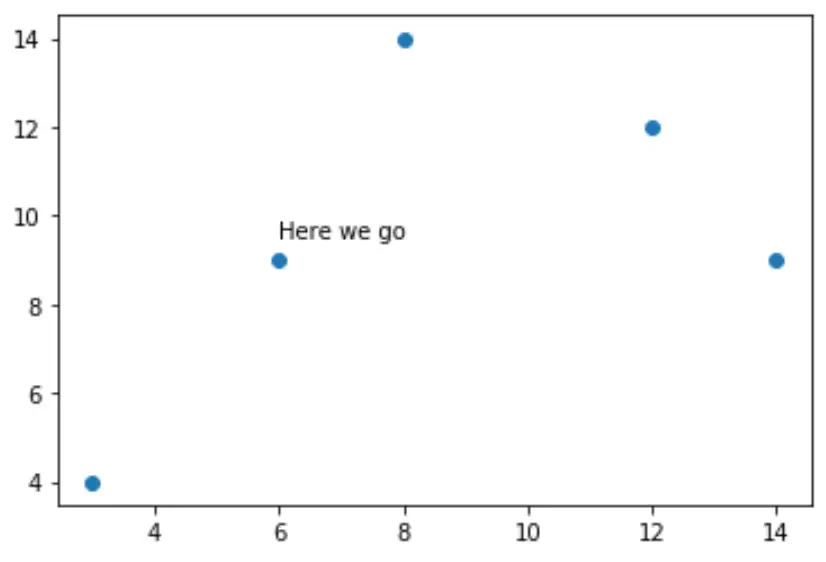
Contoh 1: Tambahkan teks unik ke plot Matplotlib
Kode berikut menunjukkan cara membuat plot sebar dan menambahkan satu bagian teks ke plot:
 import matplotlib. pyplot as plt

#createdata
x = [3, 6, 8, 12, 14]
y = [4, 9, 14, 12, 9]

#create scatterplot
plt. scatter (x,y)

#add text at (x, y) coordinates = (6, 9.5)
plt. text (6, 9.5, ' Here we go ')
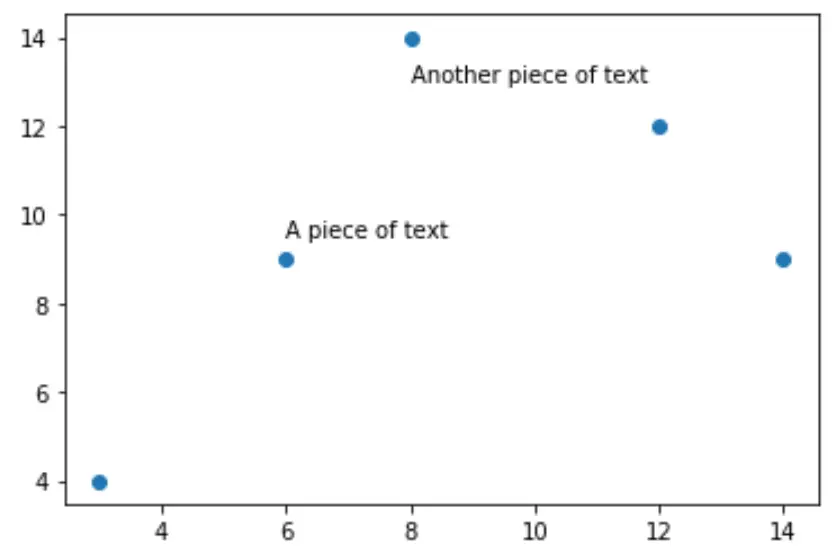
Contoh 2: Tambahkan beberapa teks ke plot Matplotlib
Kode berikut menunjukkan cara membuat plot sebar dan menambahkan beberapa bagian teks ke plot:
 import matplotlib. pyplot as plt

#create data
x = [3, 6, 8, 12, 14]
y = [4, 9, 14, 12, 9]

#create scatterplot
plt. scatter (x,y)

#add text at (x, y) coordinates = (6, 9.5)
plt. text (6, 9.5, ' A piece of text ')

#add another piece of text
plt. text (8, 13, ' Another piece of text ')
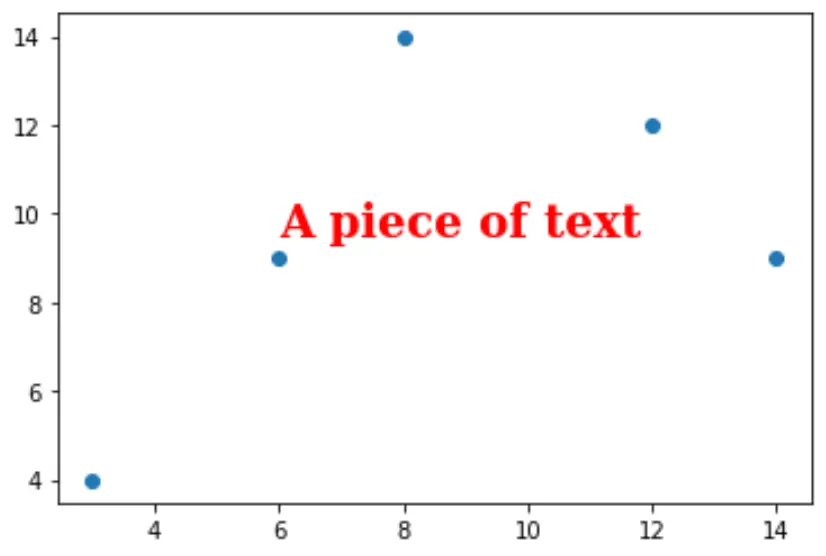
Contoh 3: Edit properti teks
Untuk mengubah properti teks, kita dapat membuat kamus yang menentukan properti font.
Kode berikut menunjukkan cara melakukan ini:
 import matplotlib. pyplot as plt

#createdata
x = [3, 6, 8, 12, 14]
y = [4, 9, 14, 12, 9]

#create scatterplot
plt. scatter (x,y)

font = {' family ': ' serif ',
        ' color ': ' red ',
        ' weight ': ' bold ',
        ' size ': 20
        }

#add text with custom font
plt. text (6, 9.5, ' A piece of text ', fontdict=font)
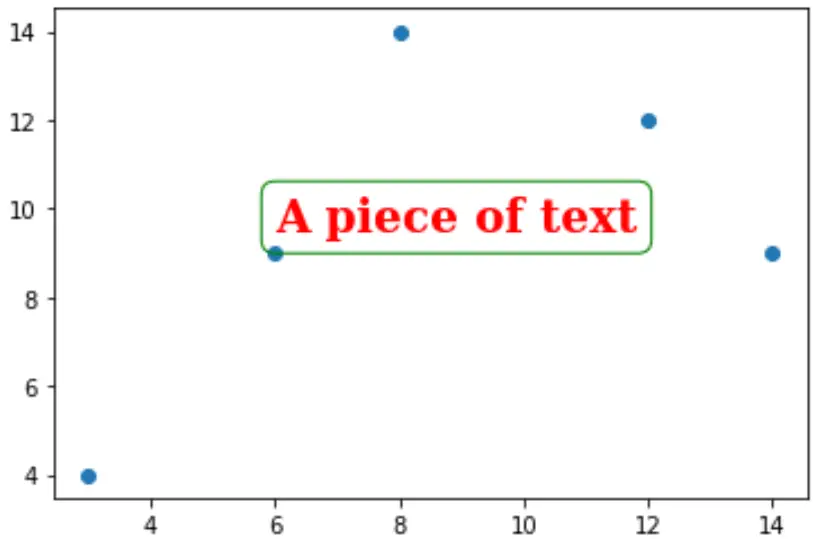
Contoh 4: Tambahkan bingkai di sekeliling teks
Kode berikut menunjukkan cara menambahkan bingkai di sekitar teks:
 import matplotlib. pyplot as plt

#createdata
x = [3, 6, 8, 12, 14]
y = [4, 9, 14, 12, 9]

#create scatterplot
plt. scatter (x,y)

font = {' family ': ' serif ',
        ' color ': ' red ',
        ' weight ': ' bold ',
        ' size ': 20
        }

box = {' facecolor ': ' none ',
       ' edgecolor ': ' green ',
       ' boxstyle ': ' round '
      }

#add text with custom font
plt. text (6, 9.5, ' A piece of text ', fontdict=font, bbox=box)
Sumber daya tambahan
Cara memberi anotasi pada plot sebar Matplotlib
Cara mengubah ukuran font pada plot Matplotlib
Tentang Penulis
Benjamin anderson
Halo, saya Benjamin, pensiunan profesor statistika yang menjadi guru Statorial yang berdedikasi. Dengan pengalaman dan keahlian yang luas di bidang statistika, saya ingin berbagi ilmu untuk memberdayakan mahasiswa melalui Statorials. Baca selengkapnya