Cara mendapatkan batas sumbu di matplotlib (dengan contoh)
Anda dapat menggunakan sintaks berikut untuk mendapatkan batas sumbu untuk sumbu x dan y plot di Matplotlib:
 import matplotlib. pyplot as plt

#get x-axis and y-axis limits
xmin, xmax, ymin, ymax = plt. axis ()

#print axis limits
print (xmin, xmax, ymin, ymax)
Contoh berikut menunjukkan cara menggunakan sintaksis ini dalam praktiknya.
Contoh: Cara mendapatkan batas sumbu di Matplotlib
Misalkan kita membuat scatterplot berikut di Matplotlib:
 import matplotlib. pyplot as plt

#define x and y
x = [1, 2, 3, 4, 5, 6, 7, 8, 9, 10]
y = [1, 5, 9, 15, 24, 39, 35, 35, 40, 41]

#create scatter plot of x vs. y
plt. scatter (x,y)
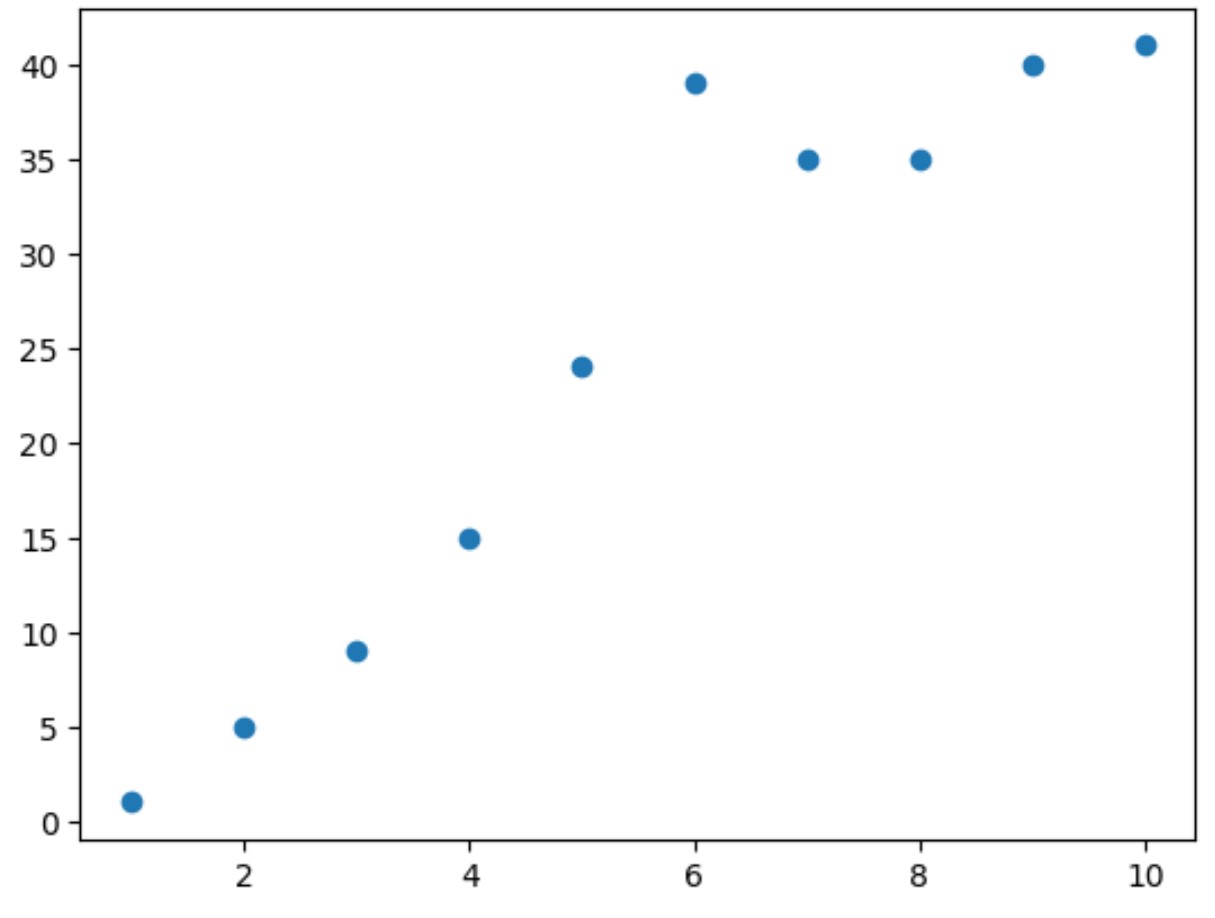
Kita dapat menggunakan sintaks berikut untuk mendapatkan batas sumbu sumbu x dan y dari plot sebar:
 import matplotlib. pyplot as plt

#define x and y
x = [1, 2, 3, 4, 5, 6, 7, 8, 9, 10]
y = [1, 5, 9, 15, 24, 39, 35, 35, 40, 41]

#create scatter plot of x vs. y
plt. scatter (x,y)

#get x-axis and y-axis limits
xmin, xmax, ymin, ymax = plt. axis ()

#print axis limits
print (xmin, xmax, ymin, ymax)

0.55 10.45 -1.0 43.0
Dari hasilnya kita dapat melihat:
- Minimum pada sumbu x: 0,55
- Maksimum pada sumbu x: 10,45
- Minimum pada sumbu y: -1.0
- Maksimum pada sumbu y: 43.0
Nilai-nilai ini sesuai dengan batas sumbu yang terlihat pada diagram sebar di atas.
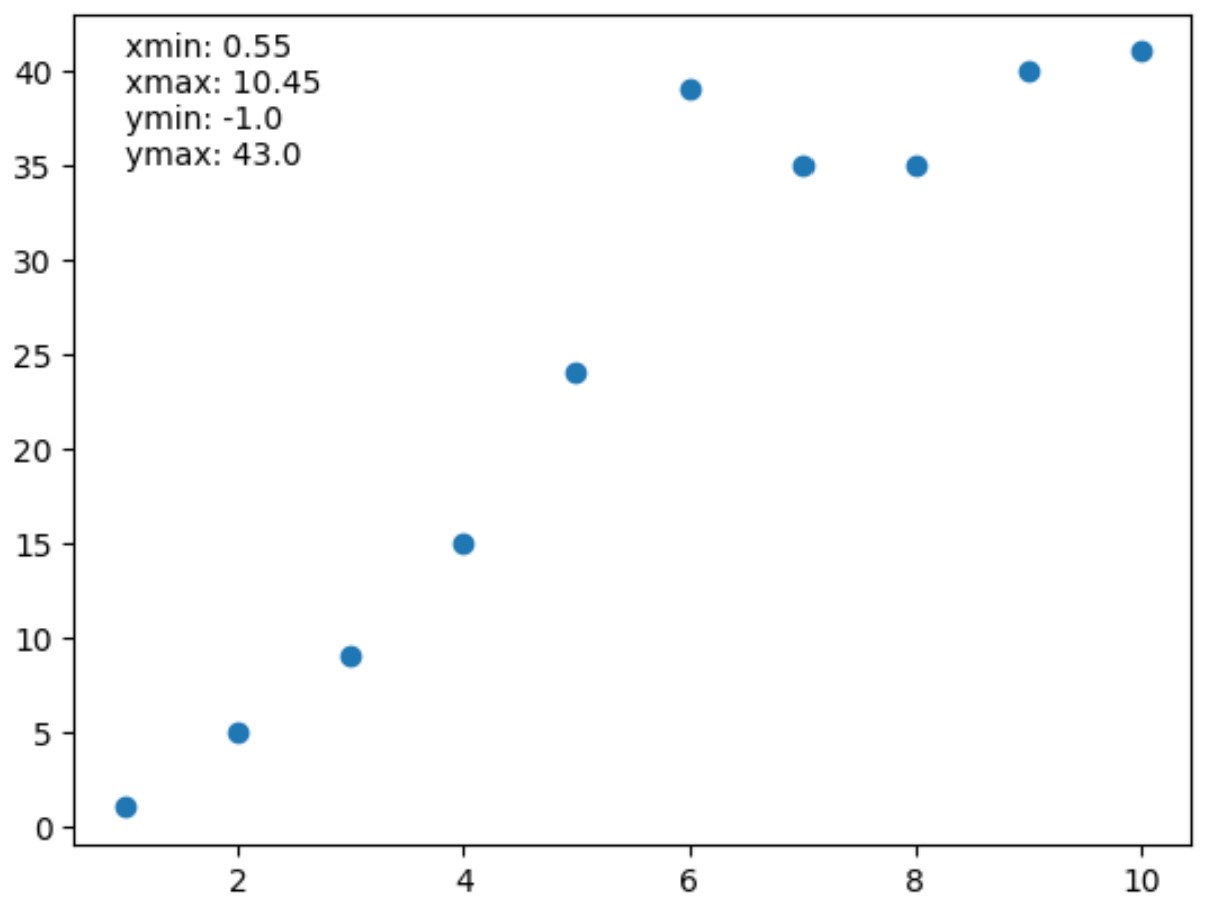
Kita juga dapat menggunakan fungsi annotate() untuk menambahkan batas sumbu ini sebagai nilai teks ke plot jika kita ingin:
 import matplotlib. pyplot as plt

#define x and y
x = [1, 2, 3, 4, 5, 6, 7, 8, 9, 10]
y = [1, 5, 9, 15, 24, 39, 35, 35, 40, 41]

#create scatter plot of x vs. y
plt. scatter (x,y)

#get x-axis and y-axis limits
xmin, xmax, ymin, ymax = plt. axis ()

#print axis limits
lims = ' xmin: ' + str(round(xmin, 2 )) + ' \n ' + \
       ' xmax: ' + str(round(xmax, 2 )) + ' \n ' + \
       ' ymin: ' + str(round(ymin, 2 )) + ' \n ' + \
       ' ymax: ' + str(round(ymax, 2 ))

#add axis limits to plot at (x,y) coordinate (1.35)
plt. annotate (lims, ( 1 , 35 ))
Sumber daya tambahan
Tutorial berikut menjelaskan cara melakukan tugas umum lainnya di Matplotlib:
Cara mengatur centang sumbu di Matplotlib
Cara menambah ukuran plot di Matplotlib
Bagaimana cara menambahkan teks ke plot Matplotlib
Tentang Penulis
Benjamin anderson
Halo, saya Benjamin, pensiunan profesor statistika yang menjadi guru Statorial yang berdedikasi. Dengan pengalaman dan keahlian yang luas di bidang statistika, saya ingin berbagi ilmu untuk memberdayakan mahasiswa melalui Statorials. Baca selengkapnya