Cara mengisi area antar baris di matplotlib
Anda dapat dengan mudah mengisi area antar nilai dalam plot Matplotlib menggunakan fungsi berikut:
- fill_between() : Mengisi area di antara dua kurva horizontal.
- fill_betweenx() : Mengisi area antara dua kurva vertikal.
Tutorial ini memberikan contoh cara menggunakan masing-masing fungsi ini dalam praktik.
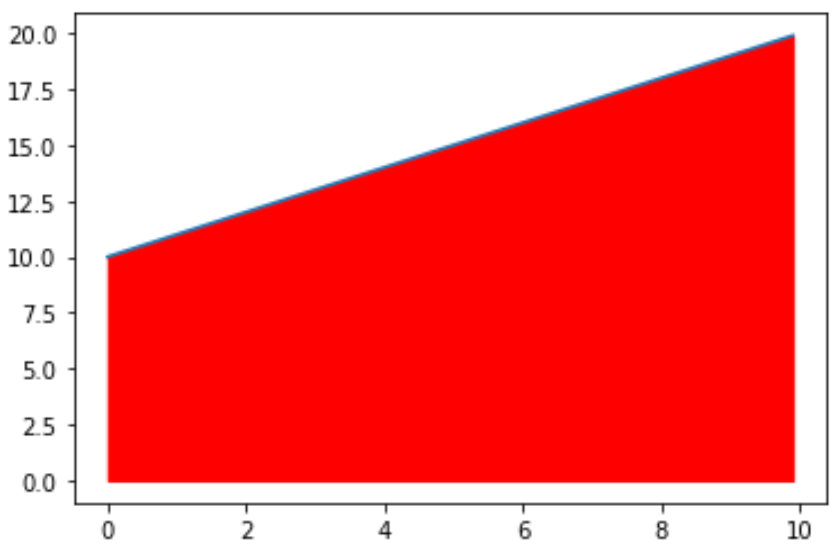
Contoh 1: Isi area di antara dua garis horizontal
Kode berikut menunjukkan cara mengisi area antara dua garis horizontal:
 import matplotlib. pyplot as plt
import numpy as np

#define x and y values
x = np. arange (0,10,0.1)
y = np. arange (10,20,0.1)

#create plot of values
plt. plot (x,y)

#fill in area between the two lines
plt. fill_between (x,y,color=' red ')
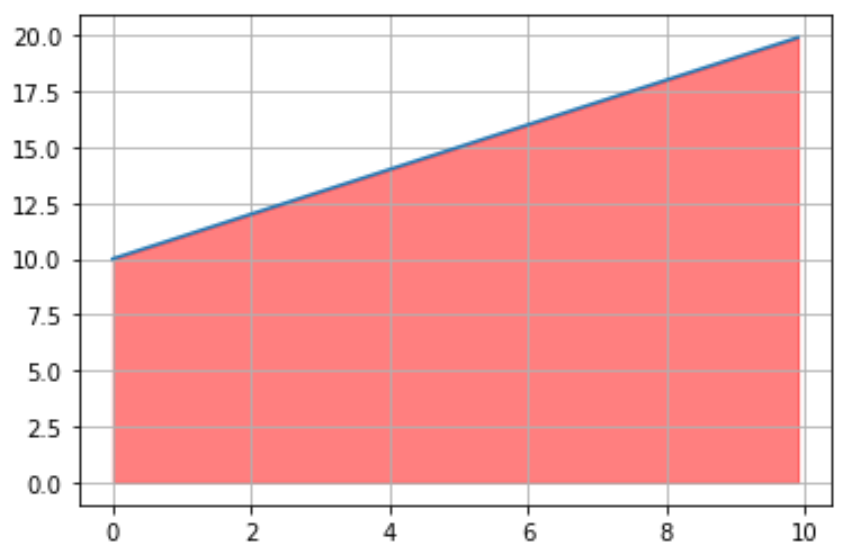
Perhatikan bahwa kita juga dapat menggunakan fungsi plt.grid() untuk menambahkan grid ke plot agar lebih mudah melihat nilai mana yang diisi:
 import matplotlib. pyplot as plt
import numpy as np

#define x and y values
x = np. arange (0,10,0.1)
y = np. arange (10,20,0.1)

#create plot of values
plt. plot (x,y)

#fill in area between the two lines
plt. fill_between (x, y, color=' red ', alpha= .5 )

#add gridlines
plt. grid ()
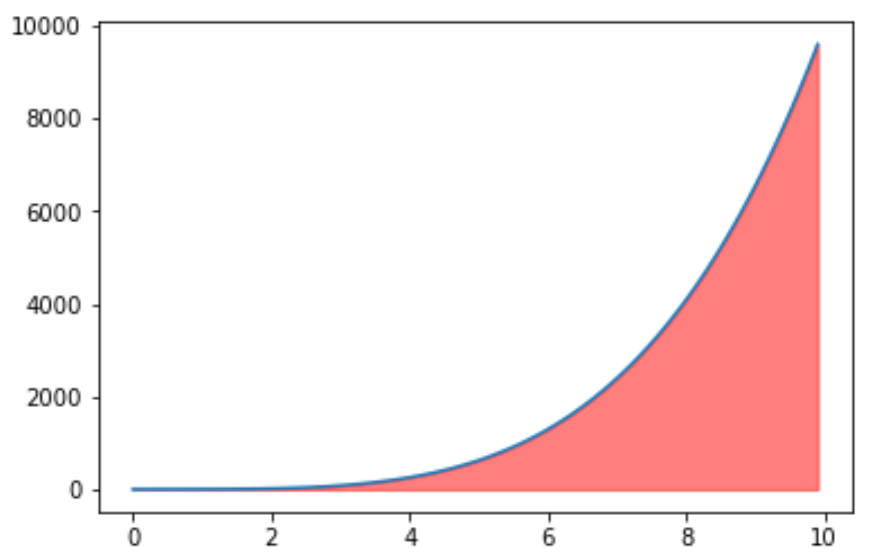
Contoh 2: Isi area di bawah kurva
Kode berikut menunjukkan cara mengisi area di bawah kurva:
 import matplotlib. pyplot as plt
import numpy as np

#define x and y values
x = np. arange (0,10,0.1)
y = x**4

#create plot of values
plt. plot (x,y)

#fill in area between the two lines
plt. fill_between (x, y, color=' red ', alpha= .5 )
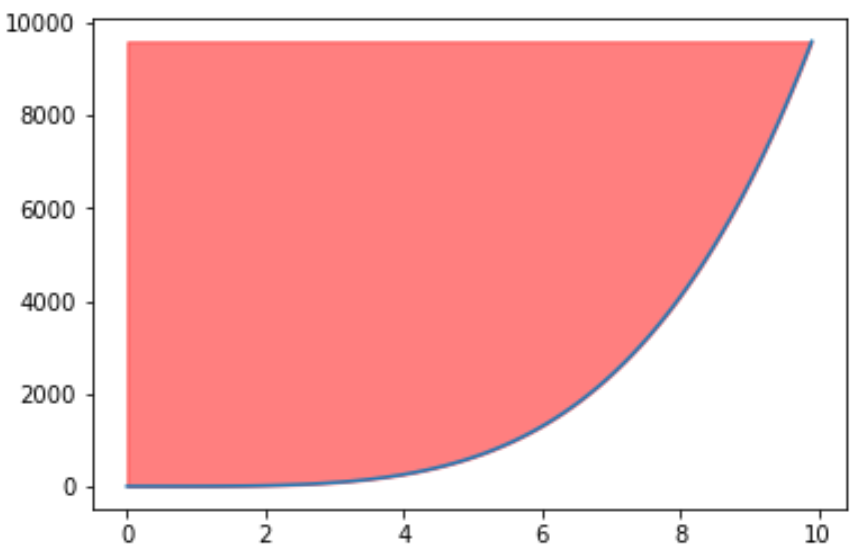
Contoh 3: Isi area di atas kurva
Kode berikut menunjukkan cara mengisi area di atas kurva:
 import matplotlib. pyplot as plt
import numpy as np

#define x and y values
x = np. arange (0,10,0.1)
y = x**4

#create plot of values
plt. plot (x,y)

#fill in area between the two lines
plt. fill_between (x, y, np. max (y), color=' red ', alpha= .5 )
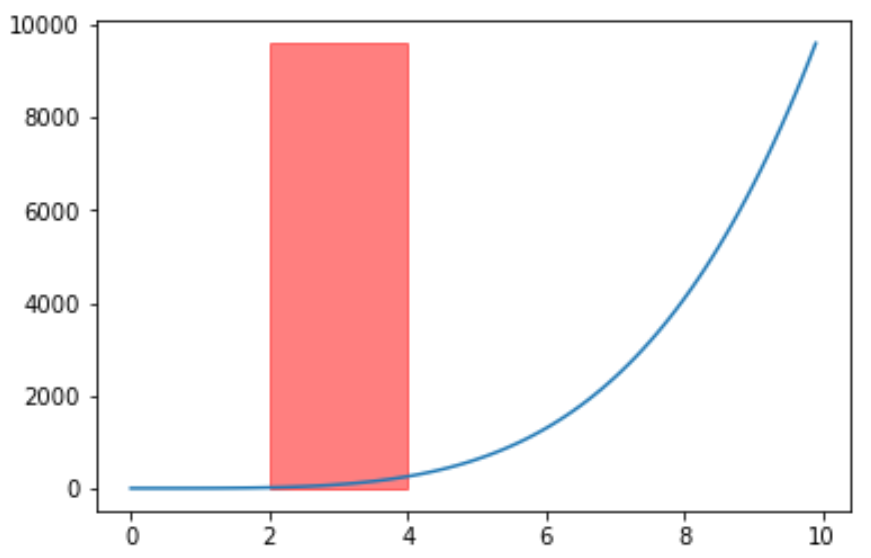
Contoh 4: Isi area di antara dua garis vertikal
Kode berikut menunjukkan cara menggunakan fungsi fill_betweenx() untuk mengisi area antara dua garis vertikal:
 import matplotlib. pyplot as plt
import numpy as np

#define x and y values
x = np. arange (0,10,0.1)
y = np. arange (10,20,0.1)

#create plot of values
plt. plot (x,y)

#fill in area between the two lines
plt. fill_betweenx (y, 2, 4, color=' red ', alpha= .5 )
Tentang Penulis
Benjamin anderson
Halo, saya Benjamin, pensiunan profesor statistika yang menjadi guru Statorial yang berdedikasi. Dengan pengalaman dan keahlian yang luas di bidang statistika, saya ingin berbagi ilmu untuk memberdayakan mahasiswa melalui Statorials. Baca selengkapnya