Bagaimana mengubah posisi legenda di matplotlib
Untuk mengubah posisi legenda di Matplotlib, Anda dapat menggunakan fungsi plt.legend() .
Misalnya, Anda dapat menggunakan sintaks berikut untuk menempatkan legenda di sudut kiri atas plot:
plt. legend (loc=' upper left ')
Lokasi defaultnya adalah “terbaik” – di sinilah Matplotlib secara otomatis menemukan lokasi untuk legenda berdasarkan tempat yang tidak mencakup titik data.
Namun, Anda dapat menentukan salah satu lokasi keterangan berikut:
- Kanan atas
- di pojok kiri atas
- di kiri bawah
- di kanan bawah
- BENAR
- kiri tengah
- Kanan-tengah
- Tengah bawah
- tengah atas
- tengah
Anda juga dapat menggunakan argumen bbox_to_anchor() untuk menempatkan legenda di luar plot. Misalnya, Anda dapat menggunakan sintaks berikut untuk menempatkan legenda di sudut kanan atas di luar plot:
plt. legend (bbox_to_anchor=( 1.05 , 1 ), loc=' upper left ', borderaxespad= 0 )
Contoh berikut menunjukkan cara menggunakan masing-masing metode ini dalam praktik.
Contoh 1: mengubah posisi legenda di dalam plot Matplotlib
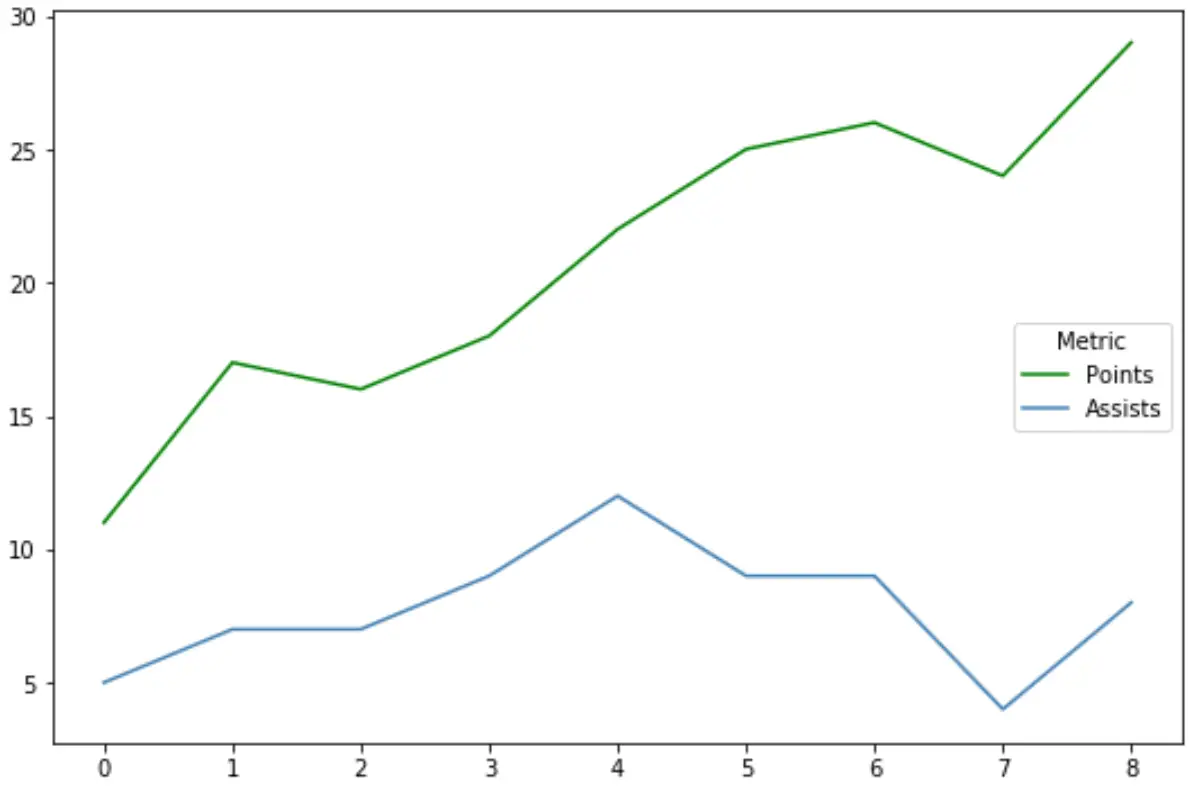
Kode berikut menunjukkan cara menempatkan legenda di bagian tengah kanan plot garis Matplotlib:
 import pandas as pd
import matplotlib. pyplot as plt

#createdata
df = pd. DataFrame ({' points ': [11, 17, 16, 18, 22, 25, 26, 24, 29],
                   ' assists ': [5, 7, 7, 9, 12, 9, 9, 4, 8]})

#add lines to plot
plt. plot (df[' points '], label=' Points ', color=' green ')
plt. plot (df[' assists '], label=' Assists ', color=' steelblue ')

#place legend in center right of plot
plt. legend (loc=' center right ', title=' Metric ')
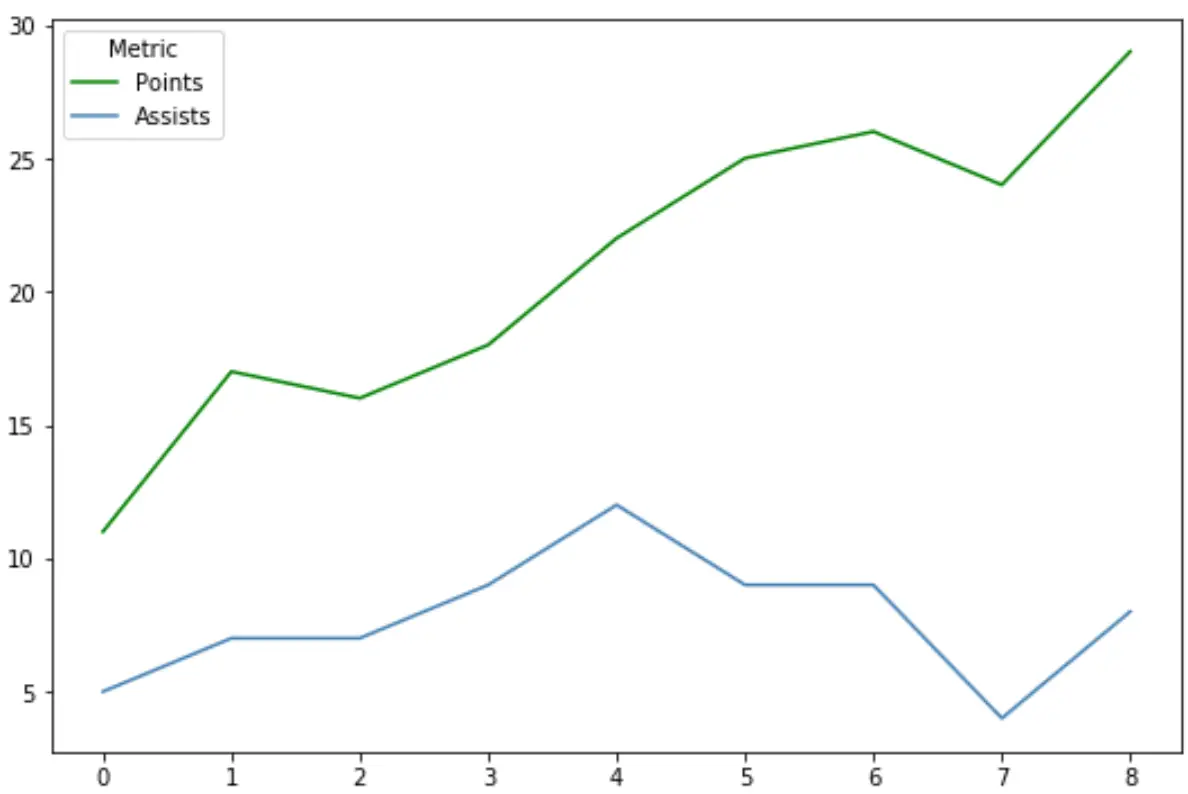
Dan kode berikut menunjukkan cara menempatkan legenda di kiri atas plot Matplotlib:
 import pandas as pd
import matplotlib. pyplot as plt

#create data
df = pd. DataFrame ({' points ': [11, 17, 16, 18, 22, 25, 26, 24, 29],
                   ' assists ': [5, 7, 7, 9, 12, 9, 9, 4, 8]})

#add lines to plot
plt. plot (df[' points '], label=' Points ', color=' green ')
plt. plot (df[' assists '], label=' Assists ', color=' steelblue ')

#place legend in center right of plot
plt. legend (loc=' upper left ', title=' Metric ')
Contoh 2: Mengubah posisi legenda di luar plot Matplotlib
Untuk menempatkan legenda di luar plot Matplotlib, kita dapat menggunakan argumen bbox_to_anchor() .
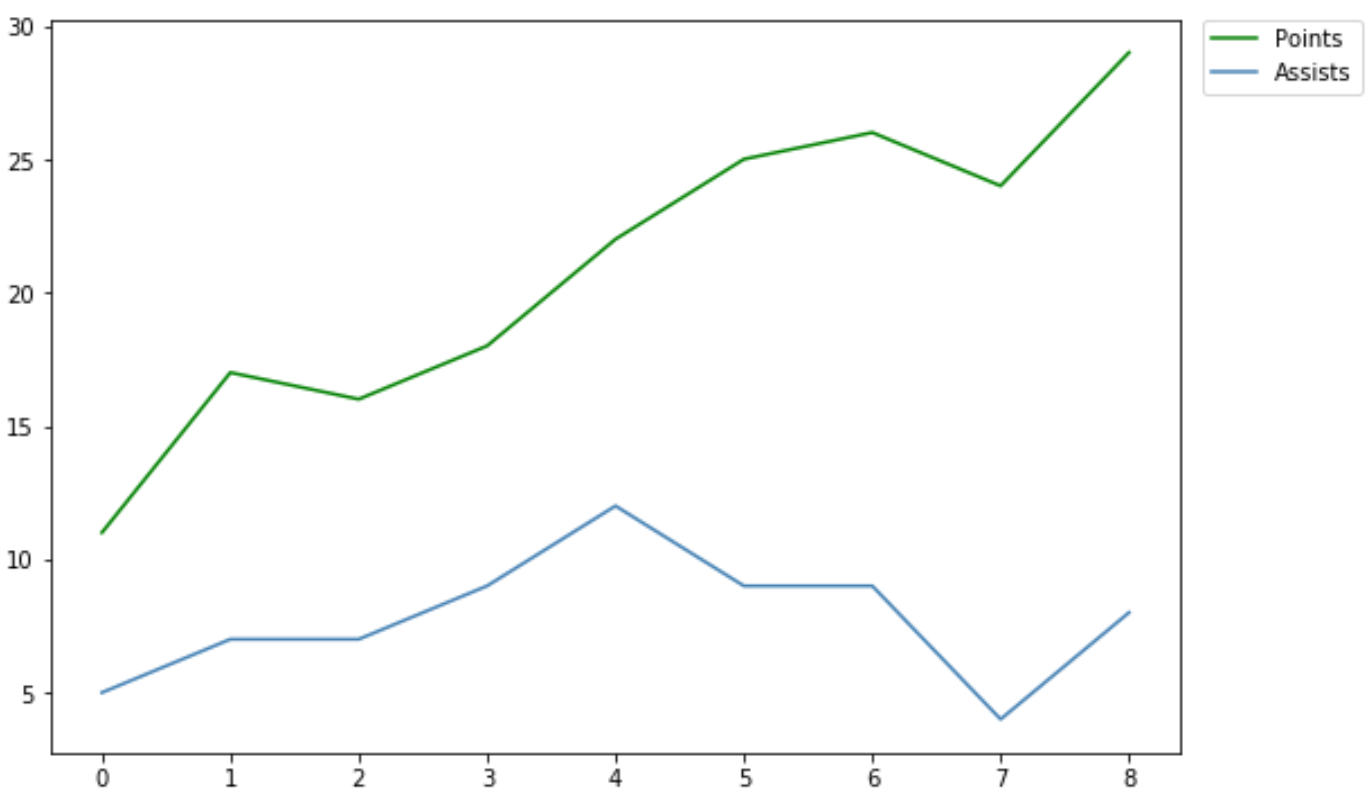
Misalnya, berikut cara menempatkan legenda di luar sudut kanan atas plot:
 import pandas as pd
import matplotlib. pyplot as plt

#create data
df = pd. DataFrame ({' points ': [11, 17, 16, 18, 22, 25, 26, 24, 29],
                   ' assists ': [5, 7, 7, 9, 12, 9, 9, 4, 8]})

#add lines to plot
plt. plot (df[' points '], label=' Points ', color=' green ')
plt. plot (df[' assists '], label=' Assists ', color=' steelblue ')

#place legend in center right of plot
plt. legend (bbox_to_anchor=( 1.02 , 1 ), loc=' upper left ', borderaxespad= 0 )
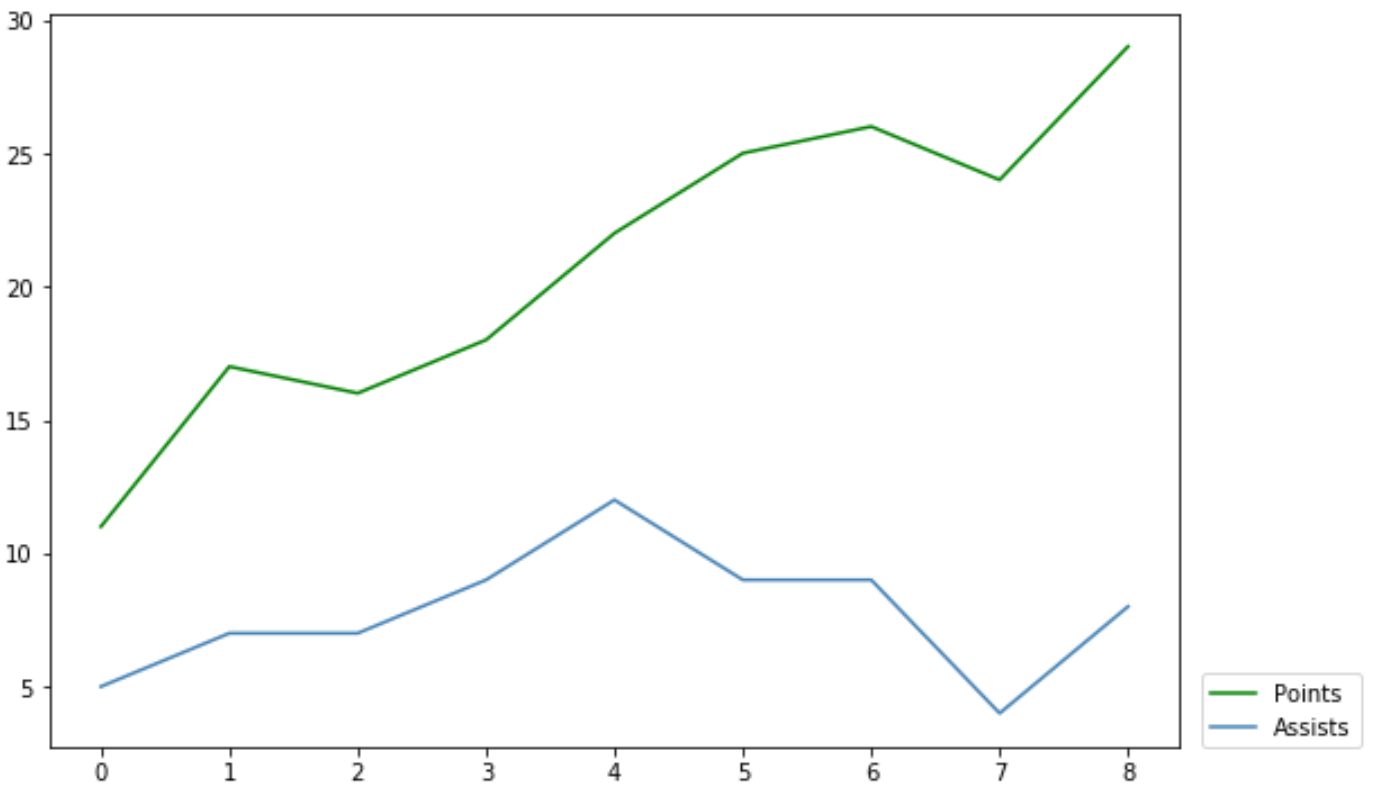
Dan berikut cara menempatkan legenda di luar pojok kanan bawah plot:
 import pandas as pd
import matplotlib. pyplot as plt

#create data
df = pd. DataFrame ({' points ': [11, 17, 16, 18, 22, 25, 26, 24, 29],
                   ' assists ': [5, 7, 7, 9, 12, 9, 9, 4, 8]})

#add lines to plot
plt. plot (df[' points '], label=' Points ', color=' green ')
plt. plot (df[' assists '], label=' Assists ', color=' steelblue ')

#place legend in center right of plot
plt. legend (bbox_to_anchor=( 1.02 , 0.1 ), loc=' upper left ', borderaxespad= 0 )
Lihat dokumentasi matplotlib untuk penjelasan mendetail tentang argumen bbox_to_anchor() .
Sumber daya tambahan
Tutorial berikut menjelaskan cara melakukan operasi umum lainnya di Matplotlib:
Bagaimana mengubah ukuran font legenda di Matplotlib
Bagaimana cara menambahkan judul ke legenda di Matplotlib
Cara menyesuaikan posisi judul di Matplotlib
Cara menyesuaikan posisi label sumbu di Matplotlib
Tentang Penulis
Benjamin anderson
Halo, saya Benjamin, pensiunan profesor statistika yang menjadi guru Statorial yang berdedikasi. Dengan pengalaman dan keahlian yang luas di bidang statistika, saya ingin berbagi ilmu untuk memberdayakan mahasiswa melalui Statorials. Baca selengkapnya