Cara memplot banyak plot pada grafik yang sama di r (3 contoh)
Anda dapat menggunakan metode berikut untuk menggambar beberapa plot pada grafik yang sama di R:
Metode 1: Gambarlah beberapa garis pada grafik yang sama
 #plot first line
plot(x, y1, type=' l ')

#add second line to plot
lines(x, y2)
Metode 2: Buat Banyak Jalur Berdampingan
 #define plotting area as one row and two columns
by(mfrow = c(1, 2))

#create first plot
plot(x, y1, type=' l ')

#create second plot
plot(x, y2, type=' l ')
Metode 3: Buat Beberapa Plot Bertumpuk Vertikal
 #define plotting area as two rows and one column
by(mfrow = c(2, 1))

#create first plot
plot(x, y1, type=' l ')

#create second plot
plot(x, y2, type=' l ')
Contoh berikut menunjukkan cara menggunakan masing-masing metode dalam praktik.
Contoh 1: Menggambar Beberapa Garis pada Grafik yang Sama
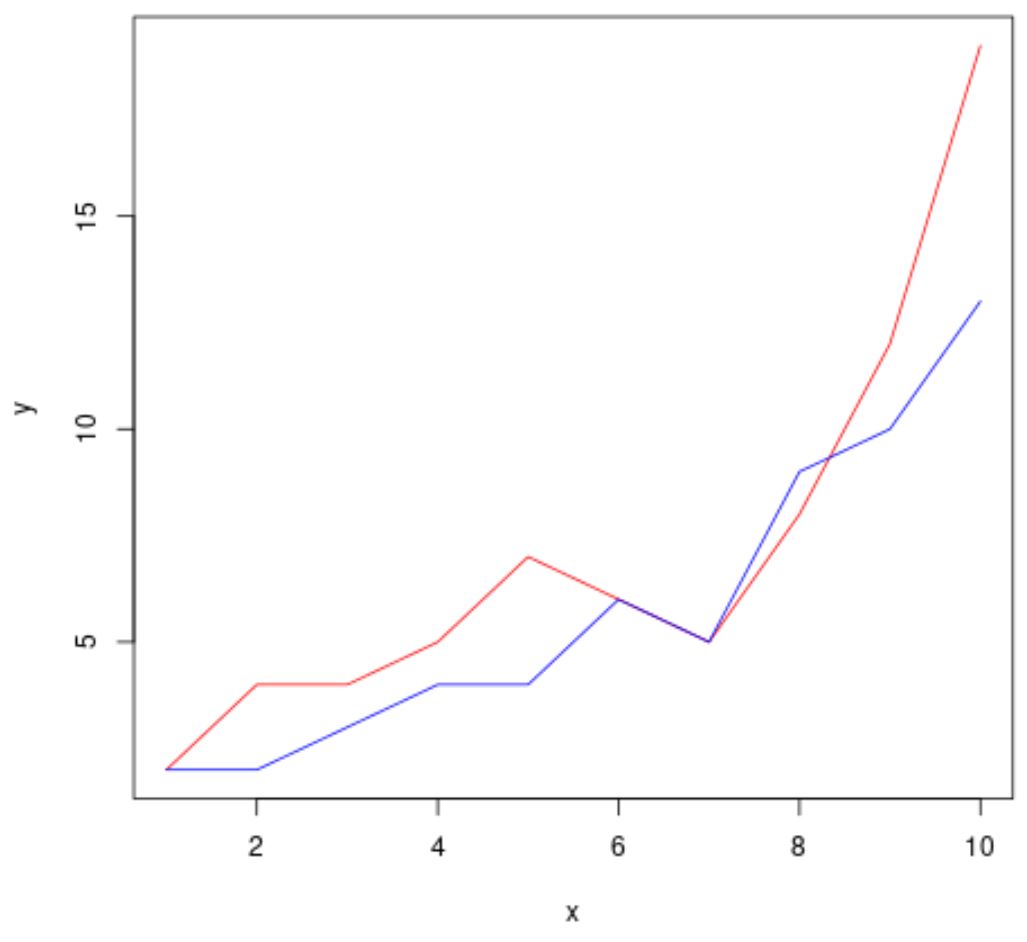
Kode berikut menunjukkan cara menggambar dua garis pada grafik yang sama di R:
 #define data to plot
x <- 1:10
y1 <- c(2, 4, 4, 5, 7, 6, 5, 8, 12, 19)
y2 <- c(2, 2, 3, 4, 4, 6, 5, 9, 10, 13)

#plot first line
plot(x, y1, type=' l ', col=' red ', xlab=' x ', ylab=' y ')

#add second line to plot
lines(x, y2, col=' blue ')

Contoh 2: Buat Beberapa Jalur Berdampingan
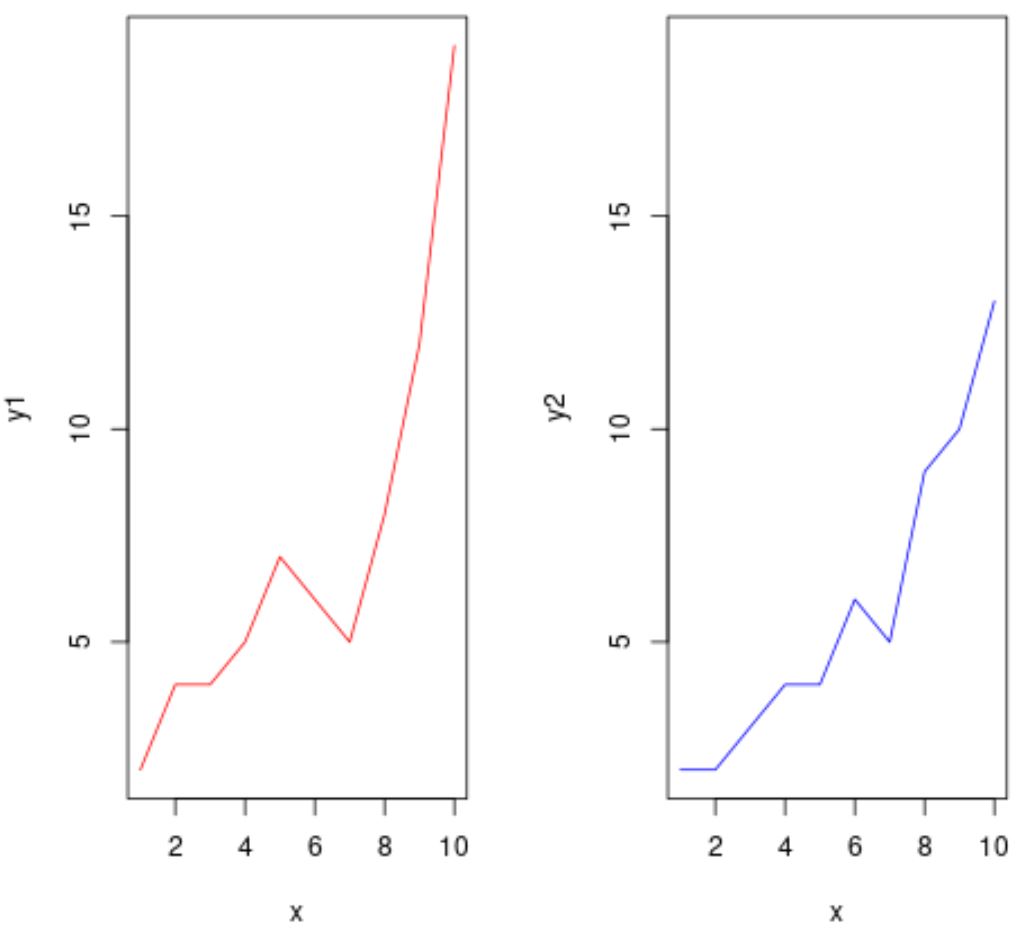
Kode berikut menunjukkan cara menggunakan argumen par() untuk memplot beberapa plot secara berdampingan:
 #define data to plot
x <- 1:10
y1 <- c(2, 4, 4, 5, 7, 6, 5, 8, 12, 19)
y2 <- c(2, 2, 3, 4, 4, 6, 5, 9, 10, 13)

#define plotting area as one row and two columns
by(mfrow = c(1, 2))

#create first line plot
plot(x, y1, type=' l ', col=' red ')

#create second line plot
plot(x, y2, type=' l ', col=' blue ', ylim=c(min(y1), max(y1)))

Perhatikan bahwa kami menggunakan argumen ylim() di plot kedua untuk memastikan bahwa kedua plot memiliki batas yang sama pada sumbu y.
Contoh 3: Membuat Beberapa Plot Bertumpuk Vertikal
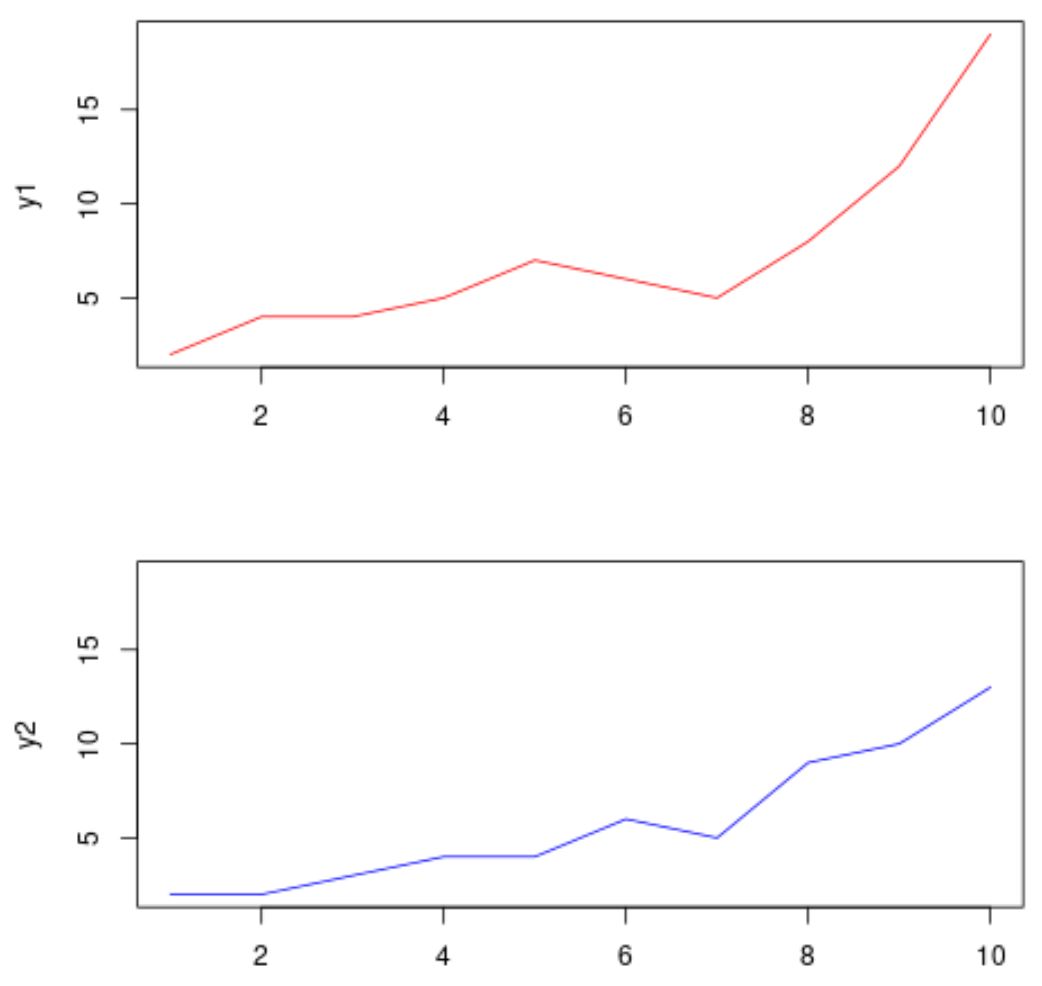
Kode berikut menunjukkan cara menggunakan argumen par() untuk memplot beberapa plot yang ditumpuk secara vertikal:
 #define data to plot
x <- 1:10
y1 <- c(2, 4, 4, 5, 7, 6, 5, 8, 12, 19)
y2 <- c(2, 2, 3, 4, 4, 6, 5, 9, 10, 13)

#define plotting area as two rows and one column
par(mfrow = c(2, 1), mar = c(2, 4, 4, 2))
#create first line plot
plot(x, y1, type=' l ', col=' red ')

#create second line plot
plot(x, y2, type=' l ', col=' blue ', ylim=c(min(y1), max(y1)))

Perhatikan bahwa kita menggunakan argumen mar untuk menentukan margin (bawah, kiri, atas, kanan) area plot.
Catatan: Standarnya adalah mar = c(5.1, 4.1, 4.1, 2.1)
Sumber daya tambahan
Tutorial berikut menjelaskan cara melakukan tugas umum lainnya di R:
Cara memplot banyak kolom di R
Cara menggambar legenda di luar plot di R
Cara membuat plot log-log di R