Cara mengatur rasio aspek di matplotlib
Rasio aspek plot matplotlib mengacu pada aspek penskalaan sumbu, yaitu rasio unit y terhadap unit x.
Rasio ini dapat dimodifikasi menggunakan fungsi matplotlib.axes.Axes.set_aspect() .
Di balik terpal, fungsi set_aspect() sebenarnya mengubah apa yang disebut sistem koordinat data , namun dalam praktiknya kita biasanya ingin mengubah sistem koordinat tampilan .
Untuk memfasilitasi konversi ini, kita dapat menggunakan potongan kode ini:
 #define y-unit to x-unit ratio
ratio = 1.0

#get x and y limits
x_left, x_right = ax. get_xlim ()
y_low, y_high = ax. get_ylim ()

#set aspect ratio
ax. set_aspect ( abs ((x_right-x_left)/(y_low-y_high))*ratio)
Mari kita lihat contoh penggunaan fungsi ini dalam praktiknya.
Langkah 1: Buat Plot Matplotlib Dasar
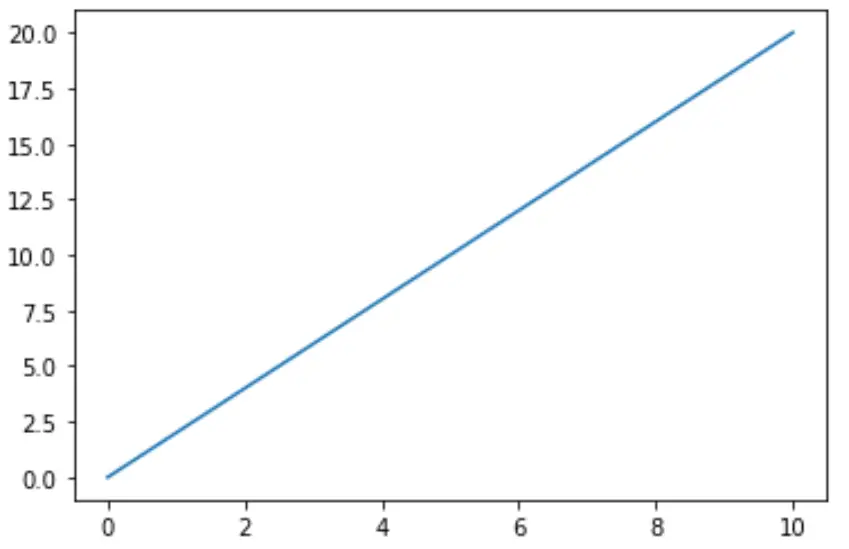
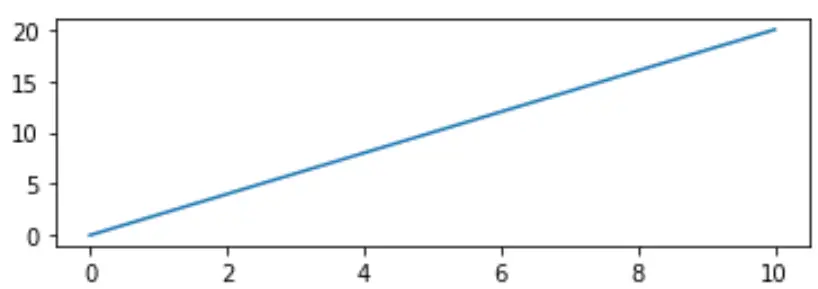
Pertama, mari buat diagram garis sederhana menggunakan Matplotlib:
 import matplotlib.pyplot as plt

#define matplotlib figure and axis
fig, ax = plt. subplots ()

#create simple line plot
ax. plot ([0, 10],[0, 20])

#displayplot
plt. show ()
Langkah 2: Atur rasio aspek (dengan cara yang salah)
Perhatikan bahwa sumbu x lebih panjang dari sumbu y. Mari kita coba atur rasio aspek ke 1, yaitu sumbu x dan sumbu y harus sama:
 import matplotlib.pyplot as plt

#define matplotlib figure and axis
fig, ax = plt. subplots ()

#create simple line plot
ax. plot ([0, 10],[0, 20])

#attempt to set aspect ratio to 1
ax. set_aspect (1)

#displayplot
plt. show ()
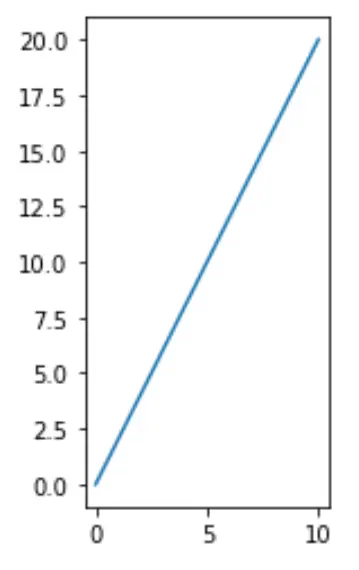
Perhatikan bahwa ini tidak berjalan sesuai harapan. Sumbu y lebih panjang dibandingkan sumbu x.
Langkah 3: Atur rasio aspek (dengan cara yang benar)
Kode berikut menunjukkan cara menggunakan perhitungan sederhana untuk mengatur rasio aspek yang benar:
 import matplotlib.pyplot as plt

#define matplotlib figure and axis
fig, ax = plt. subplots ()

#create simple line plot
ax. plot ([0, 10],[0, 20])

#set aspect ratio to 1
ratio = 1.0
x_left, x_right = ax. get_xlim ()
y_low, y_high = ax. get_ylim ()
ax. set_aspect ( abs ((x_right-x_left)/(y_low-y_high))*ratio)

#displayplot
plt. show ()
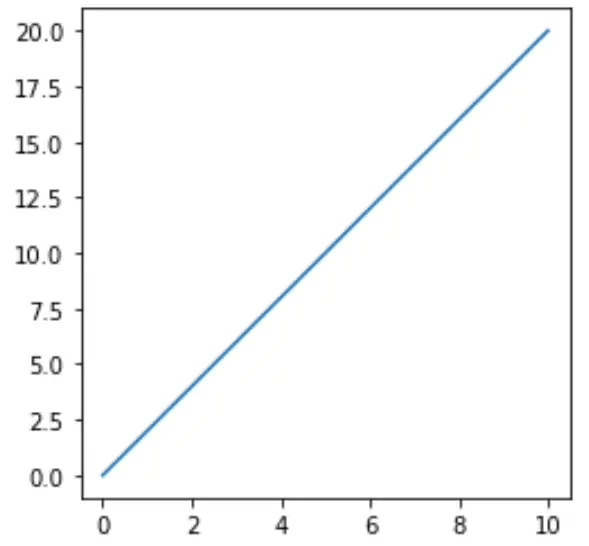
Perhatikan bahwa plot ini memiliki rasio aspek yang kami harapkan. Sumbu x dan sumbu y sama panjang.
Langkah 4: Sesuaikan rasio aspek sesuka Anda
Jika kita ingin sumbu y lebih panjang dari sumbu x, kita cukup menentukan bahwa rasio aspeknya lebih besar dari 1:
 import matplotlib.pyplot as plt

#define matplotlib figure and axis
fig, ax = plt. subplots ()

#create simple line plot
ax. plot ([0, 10],[0, 20])

#set aspect ratio to 3
ratio = 3
x_left, x_right = ax. get_xlim ()
y_low, y_high = ax. get_ylim ()
ax. set_aspect ( abs ((x_right-x_left)/(y_low-y_high))*ratio)

#displayplot
plt. show ()
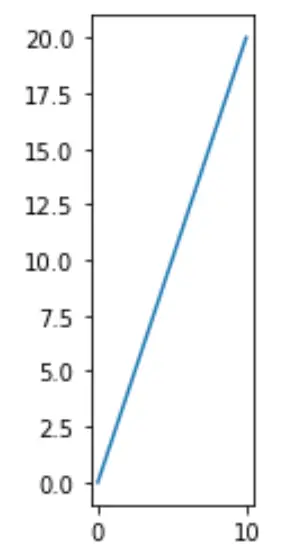
Dan jika kita ingin sumbu y lebih pendek dari sumbu x, kita cukup menentukan bahwa rasio aspeknya harus kurang dari 1:
 import matplotlib.pyplot as plt

#define matplotlib figure and axis
fig, ax = plt. subplots ()

#create simple line plot
ax. plot ([0, 10],[0, 20])

#set aspect ratio to .3
ratio = .3
x_left, x_right = ax. get_xlim ()
y_low, y_high = ax. get_ylim ()
ax. set_aspect ( abs ((x_right-x_left)/(y_low-y_high))*ratio)

#displayplot
plt. show ()
Anda dapat menemukan lebih banyak tutorial Matplotlib di sini .
Tentang Penulis
Benjamin anderson
Halo, saya Benjamin, pensiunan profesor statistika yang menjadi guru Statorial yang berdedikasi. Dengan pengalaman dan keahlian yang luas di bidang statistika, saya ingin berbagi ilmu untuk memberdayakan mahasiswa melalui Statorials. Baca selengkapnya