Cara membuat tabel dengan matplotlib
Anda dapat menggunakan salah satu dari dua metode berikut untuk membuat tabel dengan Python menggunakan Matplotlib:
Metode 1: Buat tabel dari pandas DataFrame
 #create pandas DataFrame
df = pd.DataFrame(np. random . randn (20, 2), columns=[' First ', ' Second '])

#create table
table = ax. table (cellText=df. values , colLabels=df. columns , loc=' center ')
Metode 2: Buat array dari nilai khusus
 #create values for table
table_data=[
    ["Player 1", 30],
    ["Player 2", 20],
    ["Player 3", 33],
    ["Player 4", 25],
    ["Player 5", 12]
]

#create table
table = ax. table (cellText=table_data, loc=' center ')
Tutorial ini memberikan contoh bagaimana menggunakan metode ini dalam praktik.
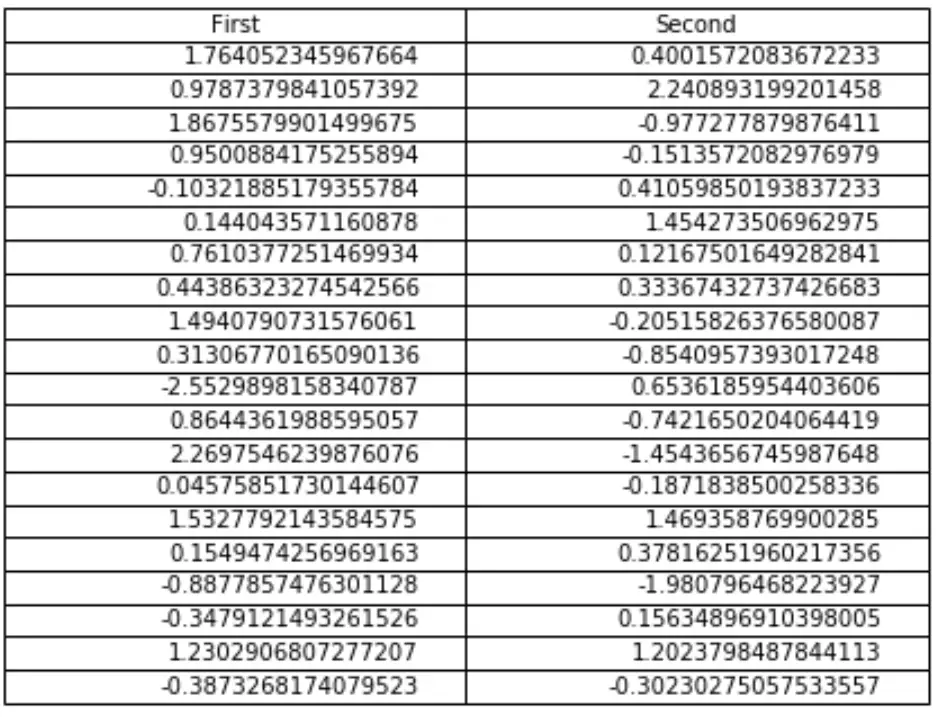
Contoh 1: Buat tabel dari pandas DataFrame
Kode berikut menunjukkan cara membuat tabel di Matplotlib yang berisi nilai pandas DataFrame:
 import numpy as np
import pandas as pd
import matplotlib.pyplot as plt

#make this example reproducible
n.p. random . seeds (0)

#define figure and axes
fig, ax = plt. subplots ()

#hide the axes
fig.patch. set_visible (False)
ax.axis(' off ')
ax.axis(' tight ')

#createdata
df = pd.DataFrame(np. random . randn (20, 2), columns=[' First ', ' Second '])

#create table
table = ax. table (cellText=df.values, colLabels=df.columns, loc=' center ')

#display table
fig. tight_layout ()
plt. show ()
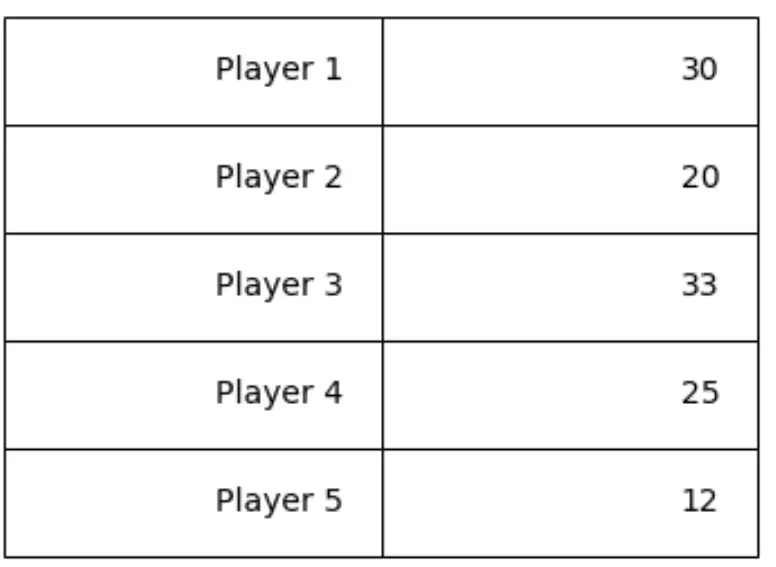
Contoh 2: Buat tabel dari nilai khusus
Kode berikut menunjukkan cara membuat tabel di Matplotlib yang berisi nilai khusus:
 import numpy as np
import pandas as pd
import matplotlib.pyplot as plt

#define figure and axes
fig, ax = plt. subplots ()

#create values for table
table_data=[
    ["Player 1", 30],
    ["Player 2", 20],
    ["Player 3", 33],
    ["Player 4", 25],
    ["Player 5", 12]
]

#create table
table = ax. table (cellText=table_data, loc=' center ')

#modify table
table. set_fontsize (14)
table. scale (1.4)
ax. axis (' off ')

#displaytable
plt. show ()
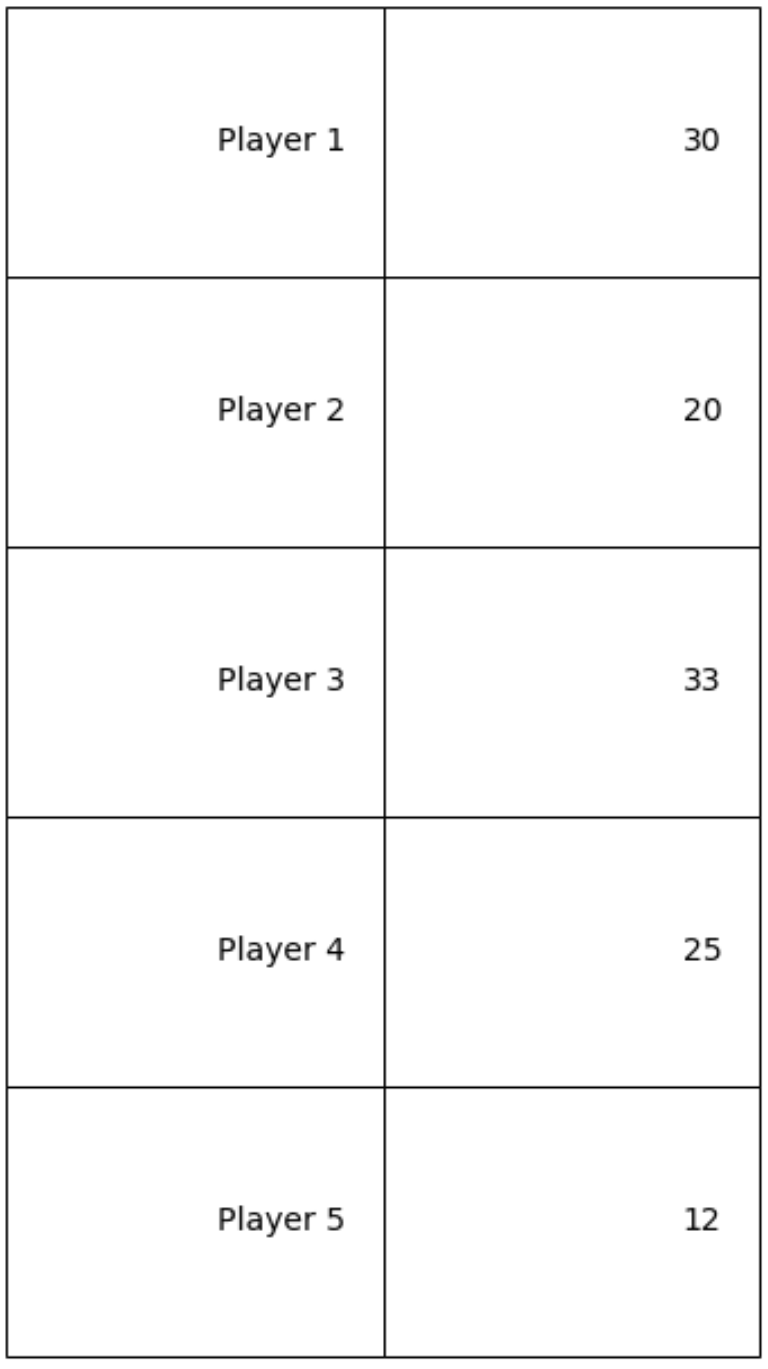
Perhatikan bahwa table.scale(width, length) mengubah lebar dan panjang tabel. Misalnya, kita dapat membuat tabel lebih panjang lagi dengan mengubah panjangnya:
table. scale (1.10)
Sumber daya tambahan
Bagaimana cara menambahkan teks ke plot Matplotlib
Cara mengatur rasio aspek di Matplotlib
Bagaimana mengubah ukuran font legenda di Matplotlib
Tentang Penulis
Benjamin anderson
Halo, saya Benjamin, pensiunan profesor statistika yang menjadi guru Statorial yang berdedikasi. Dengan pengalaman dan keahlian yang luas di bidang statistika, saya ingin berbagi ilmu untuk memberdayakan mahasiswa melalui Statorials. Baca selengkapnya