Cara menyesuaikan ukuran subplot di matplotlib
Anda dapat menggunakan sintaks berikut untuk menyesuaikan ukuran subplot di Matplotlib:
 #specify one size for all subplots
fig, ax = plt. subplots (2, 2, figsize=(10,7))

#specify individual sizes for subplots
fig, ax = plt. subplots (1, 2, gridspec_kw={' width_ratios ': [3, 1]})
Contoh berikut menunjukkan cara menggunakan sintaksis ini dalam praktiknya.
Contoh 1: Tentukan ukuran untuk semua subplot
Kode berikut menunjukkan cara menentukan ukuran untuk semua subplot:
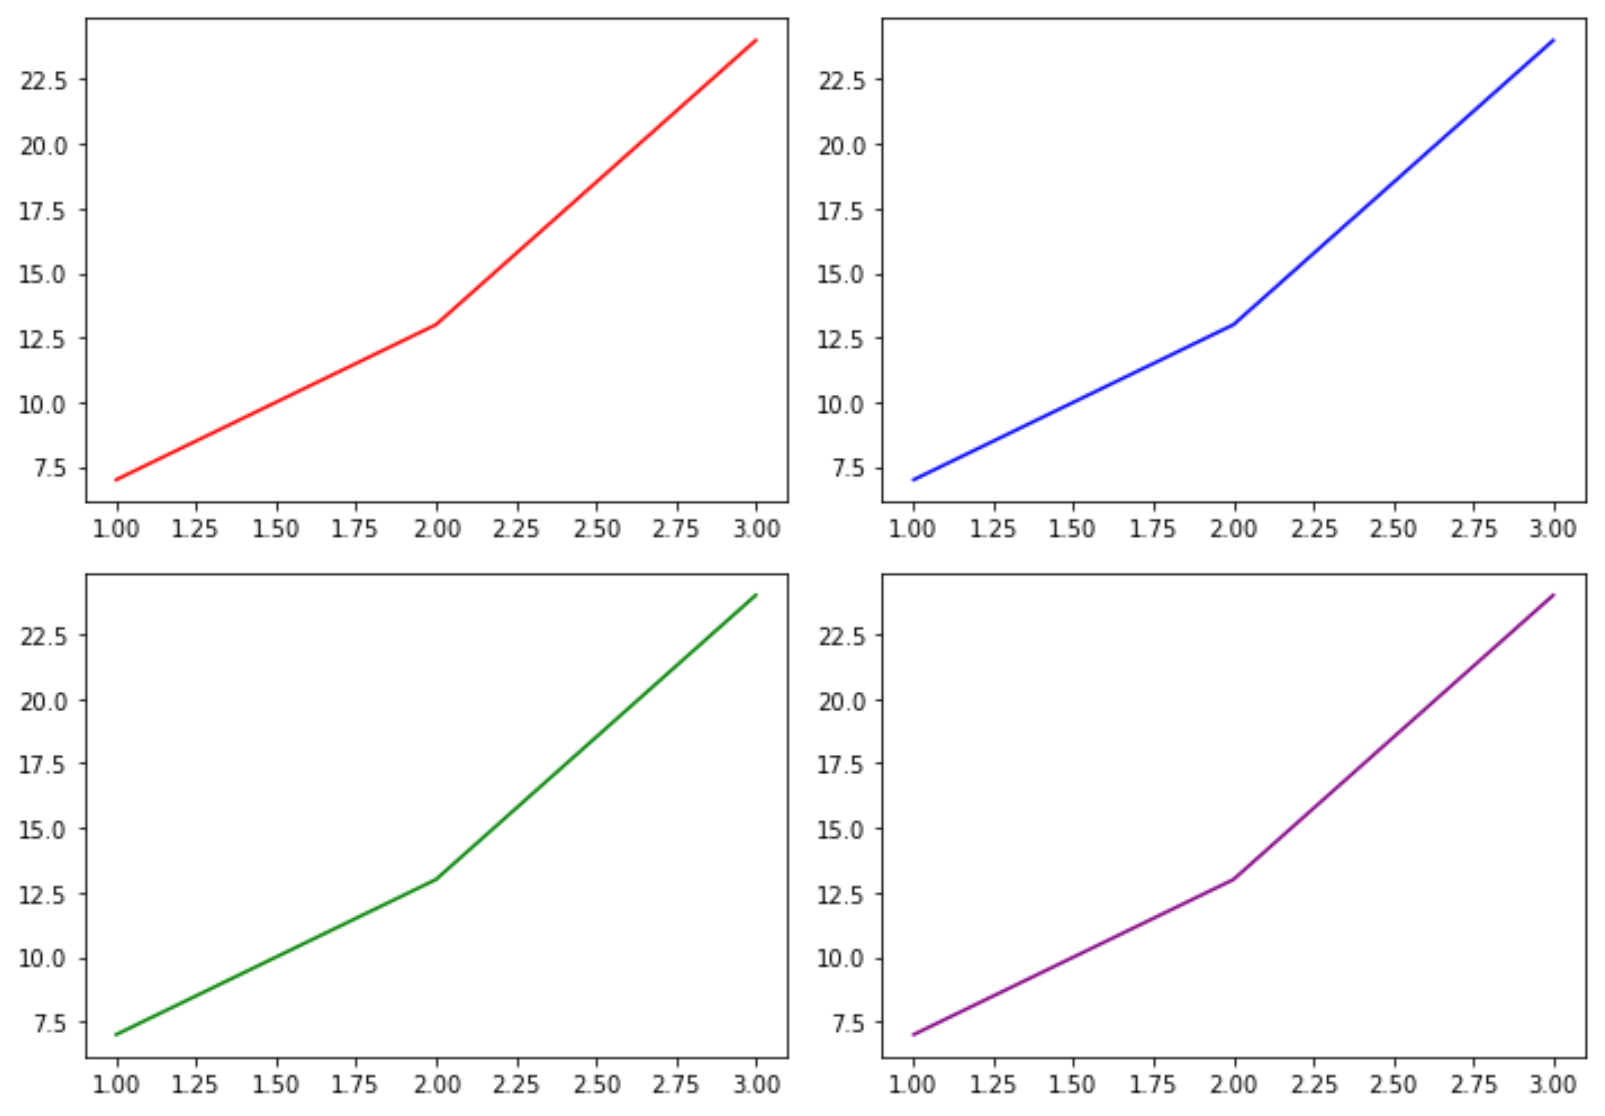
 import matplotlib. pyplot as plt

#define subplots
fig, ax = plt. subplots (2, 2, figsize=(10,7))
fig. tight_layout ()

#define data
x = [1, 2, 3]
y = [7, 13, 24]

#create subplots
ax[0, 0]. plot (x,y,color=' red ')
ax[0, 1]. plot (x,y,color=' blue ')
ax[1, 0]. plot (x,y,color=' green ')
ax[1, 1]. plot (x,y,color=' purple ')
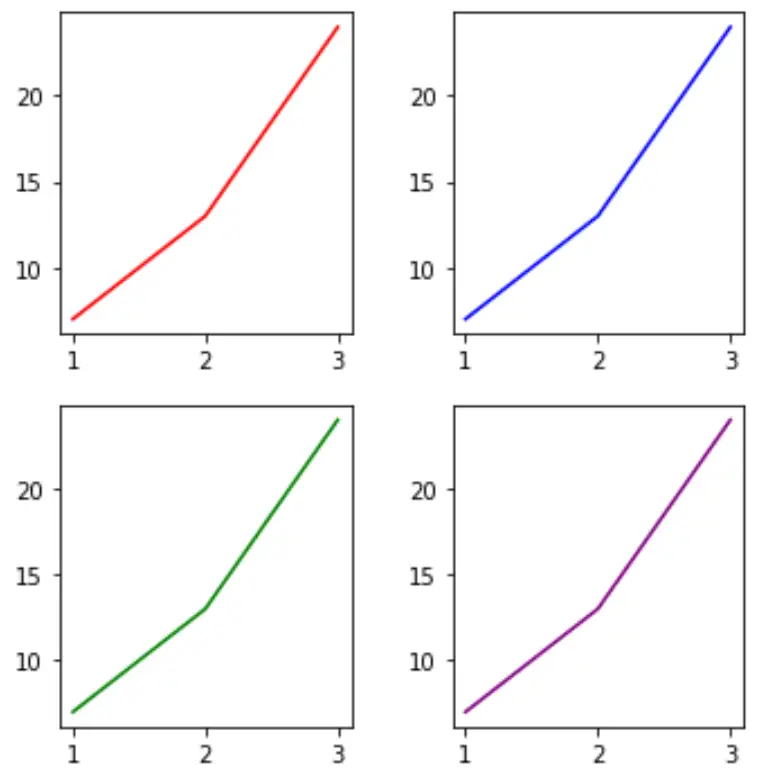
Kita dapat dengan mudah mengubah ukuran subjejak dengan mengubah nilai argumen figsize :
 import matplotlib. pyplot as plt

#define subplots
fig, ax = plt. subplots (2, 2, figsize=(5,5))
fig. tight_layout ()

#define data
x = [1, 2, 3]
y = [7, 13, 24]

#create subplots
ax[0, 0]. plot (x,y,color=' red ')
ax[0, 1]. plot (x,y,color=' blue ')
ax[1, 0]. plot (x,y,color=' green ')
ax[1, 1]. plot (x,y,color=' purple ')
Contoh 2: Tentukan ukuran masing-masing subplot
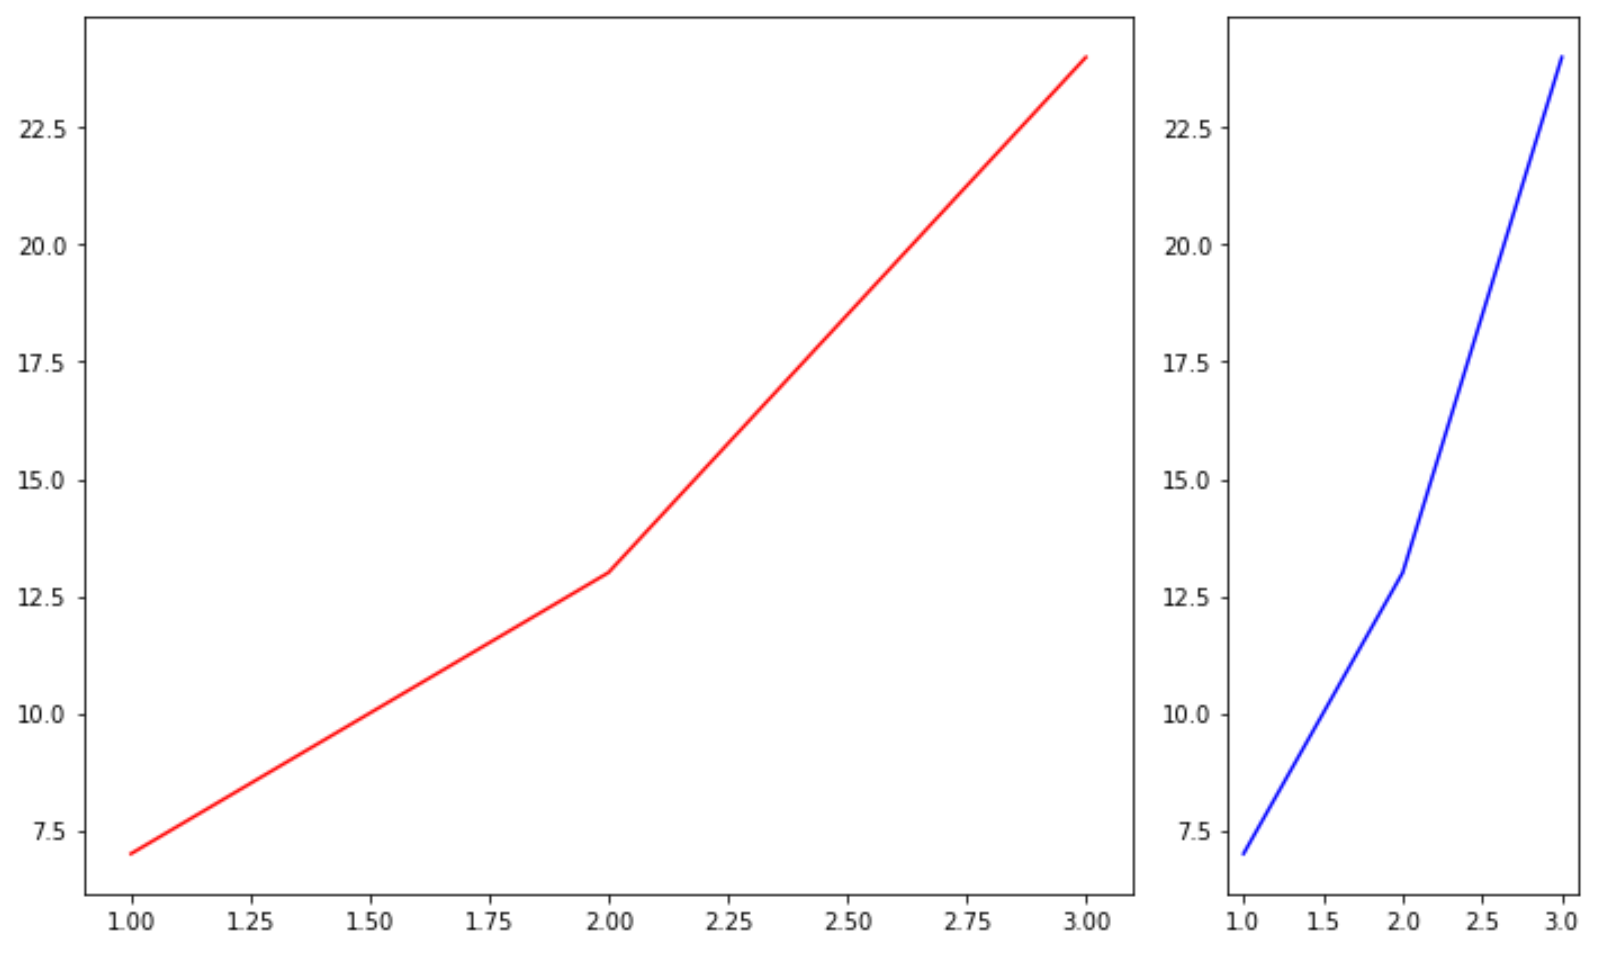
Kode berikut menunjukkan cara menentukan ukuran berbeda untuk masing-masing subplot:
 import matplotlib. pyplot as plt

#define subplots
fig, ax = plt. subplots (1, 2, gridspec_kw={' width_ratios ': [3, 1]})
fig. tight_layout ()

#define data
x = [1, 2, 3]
y = [7, 13, 24]

#create subplots
ax[0]. plot (x,y,color=' red ')
ax[1]. plot (x,y,color=' blue ')
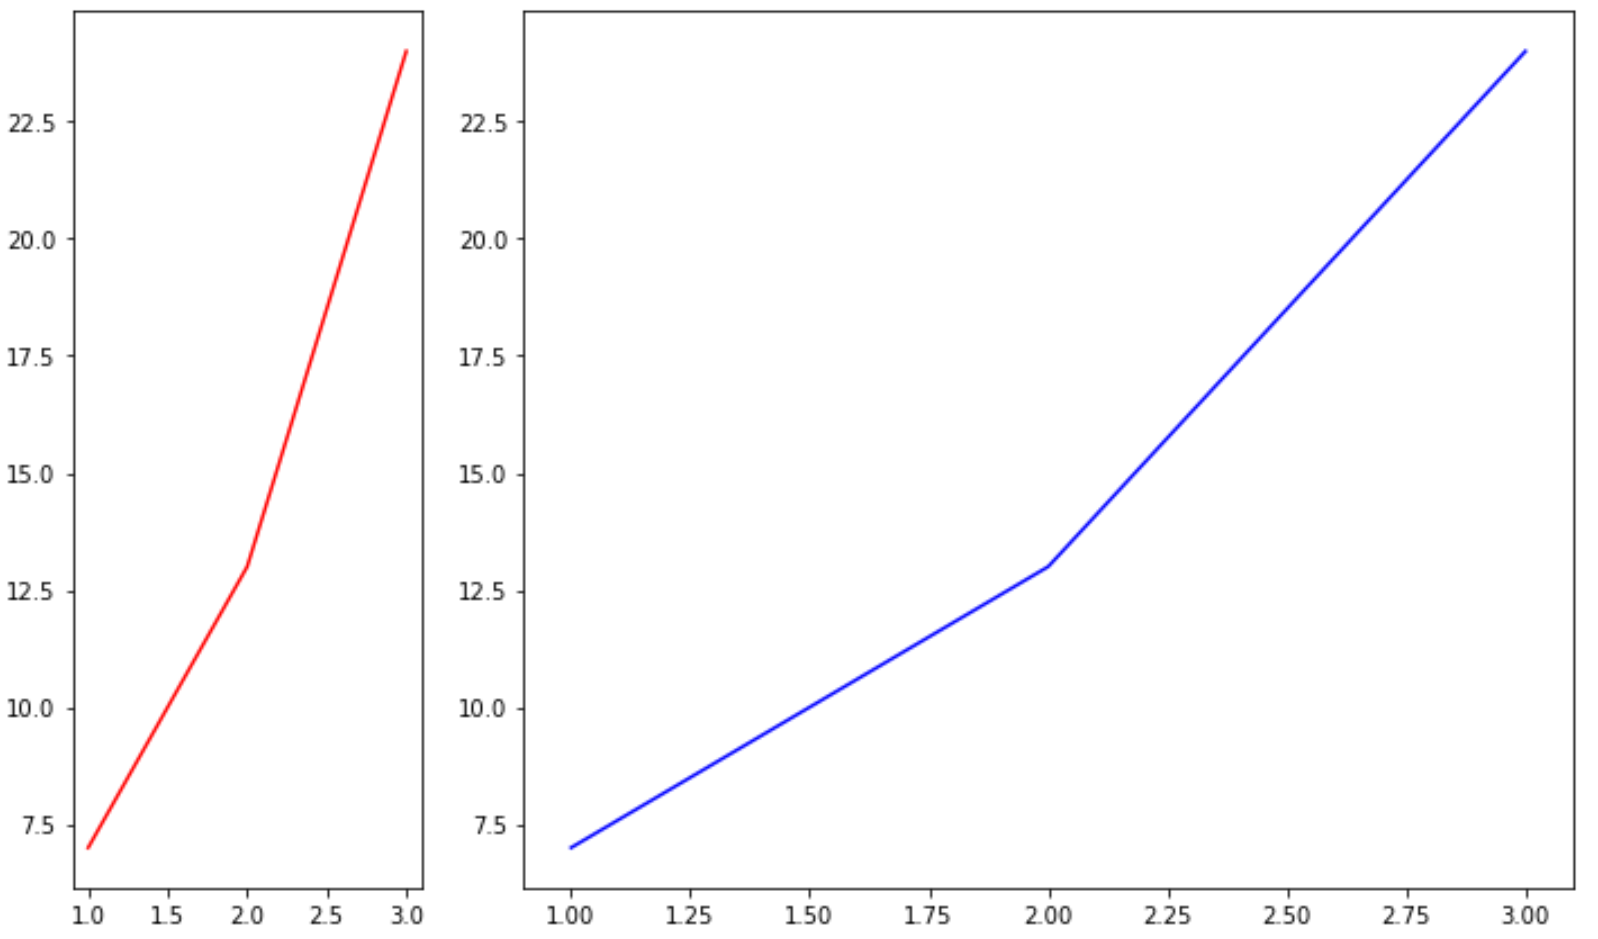
Kita dapat dengan mudah mengubah ukuran subjejak dengan mengubah nilai pada argumen width_ratios :
 import matplotlib. pyplot as plt

#define subplots
fig, ax = plt. subplots (1, 2, gridspec_kw={' width_ratios ': [1, 3]})
fig. tight_layout ()

#define data
x = [1, 2, 3]
y = [7, 13, 24]

#create subplots
ax[0]. plot (x,y,color=' red ')
ax[1]. plot (x,y,color=' blue ')
Sumber daya tambahan
Bagaimana cara menambahkan judul ke plot di Matplotlib
Cara mengatur rentang sumbu di Matplotlib
Cara mengatur nilai sumbu X di Matplotlib
Tentang Penulis
Benjamin anderson
Halo, saya Benjamin, pensiunan profesor statistika yang menjadi guru Statorial yang berdedikasi. Dengan pengalaman dan keahlian yang luas di bidang statistika, saya ingin berbagi ilmu untuk memberdayakan mahasiswa melalui Statorials. Baca selengkapnya