Matplotlib: come creare boxplot per gruppo
È possibile utilizzare la seguente sintassi per creare boxplot per gruppo in Matplotlib:
 import matplotlib as plt
import seaborn as sns

sns. boxplot (x=' group ', y=' values ', data=df)
Gli esempi seguenti mostrano come utilizzare questa sintassi per creare boxplot di gruppo per set di dati di formato lungo e di grande formato.
Esempio 1: boxplot per gruppo per dati lunghi
Il codice seguente mostra come creare boxplot per gruppo per un DataFrame panda in un formato lungo:
 import pandas as pd
import numpy as np
import matplotlib as plt
import seaborn as sns

#create long-form data
df = pd. DataFrame ({' points ': [7, 8, 9, 12, 14, 5, 6, 6, 8, 11, 8, 9, 11, 13, 17],
                   ' team ': np. repeat ([' A ',' B ',' C '],5)})

#viewdata
print (df)

    team points
0 7 A
1 8 A
2 9 A
3 12 A
4 14 A
5 5 B
6 6 B
7 6 B
8 8 B
9 11 B
10 8 C
11 9 C
12 11 C
13 13 C
14 17 C

#create boxplot by group
sns. boxplot (x=' team ', y=' points ', data=df)
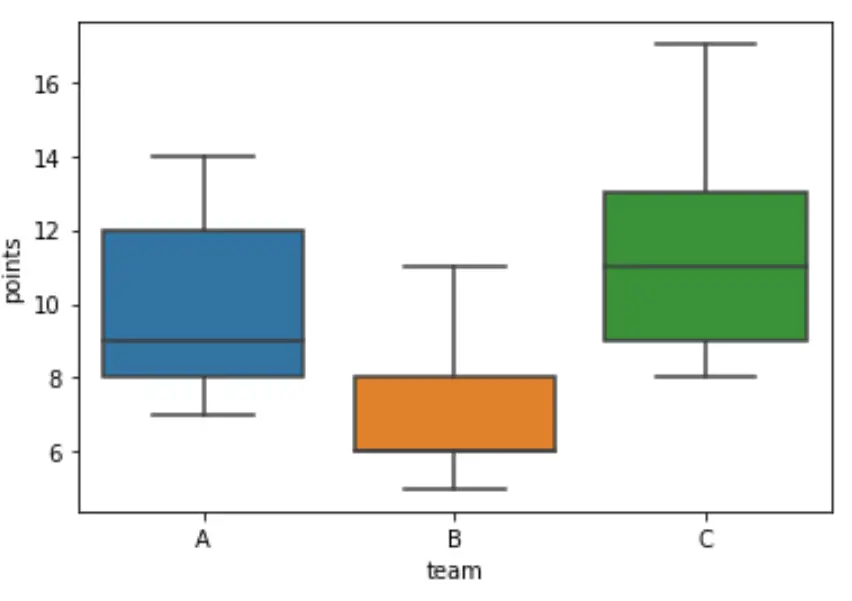
Esempio 2: box plot per gruppo per dati di grande formato
Il codice seguente mostra come creare boxplot per gruppo per un DataFrame panda in grande formato:
 import pandas as pd
import numpy as np
import matplotlib as plt
import seaborn as sns

#create wide-form data
df = pd. DataFrame ({' A ': [7, 8, 9, 12, 14],
                   ' B ': [5, 6, 6, 8, 11],
                   ' C ': [8, 9, 11, 13, 17]})

#viewdata
print (df)

    ABC
0 7 5 8
1 8 6 9
2 9 6 11
3 12 8 13
4 14 11 17

#create boxplot by group
sns. boxplot (x=' variable ', y=' value ', data= pd.melt (df)). set (
            xlabel=' team ',
            ylabel=' points ')
Risorse addizionali
Come tracciare più linee in Matplotlib
Come creare grafici a barre in pila in Matplotlib
Informazioni sull'autore
Benjamin anderson
Ciao, sono Benjamin, un professore di statistica in pensione diventato insegnante dedicato di Statorials. Con una vasta esperienza e competenza nel campo della statistica, sono ansioso di condividere le mie conoscenze per potenziare gli studenti attraverso Statorials. Scopri di più