Come disegnare frecce in matplotlib
Per disegnare frecce in Matplotlib, puoi utilizzare la funzione matplotlib.pyplot.arrow , che utilizza la seguente sintassi:
matplotlib.pyplot.arrow(x, y, dx, dy)
Oro:
- x, y: le coordinate xey della base della freccia
- dx, dy: la lunghezza della freccia nelle direzioni xey
Questo tutorial fornisce diversi esempi di utilizzo pratico di questa funzione.
Esempio 1: disegna una singola freccia
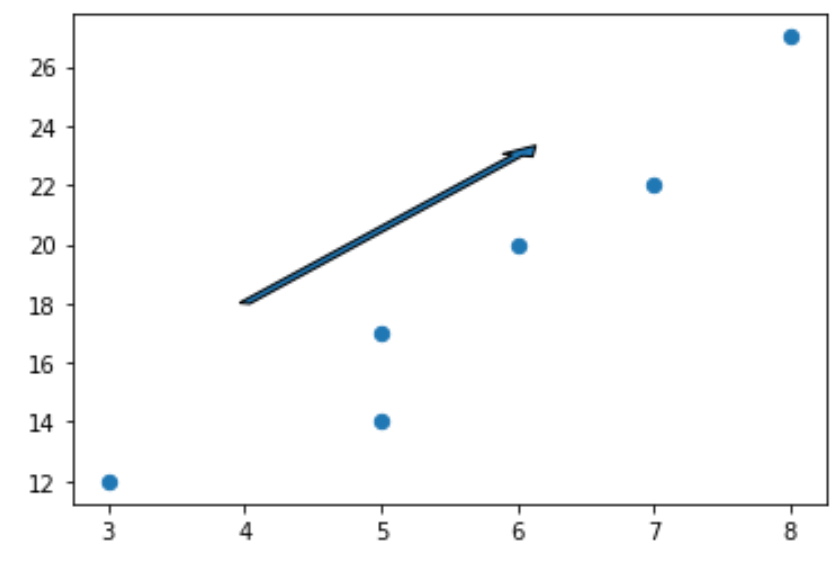
Il codice seguente mostra come disegnare una singola freccia su un grafico Matplotlib:
 import matplotlib. pyplot as plt

#define two arrays for plotting
A = [3, 5, 5, 6, 7, 8]
B = [12, 14, 17, 20, 22, 27]

#create scatterplot, specifying marker size to be 40
plt. scatter (A, B, s= 40 )

#add arrow to plot
plt. arrow (x= 4 , y= 18 , dx= 2 , dy= 5 , width= .08 )

#displayplot
plt. show ()
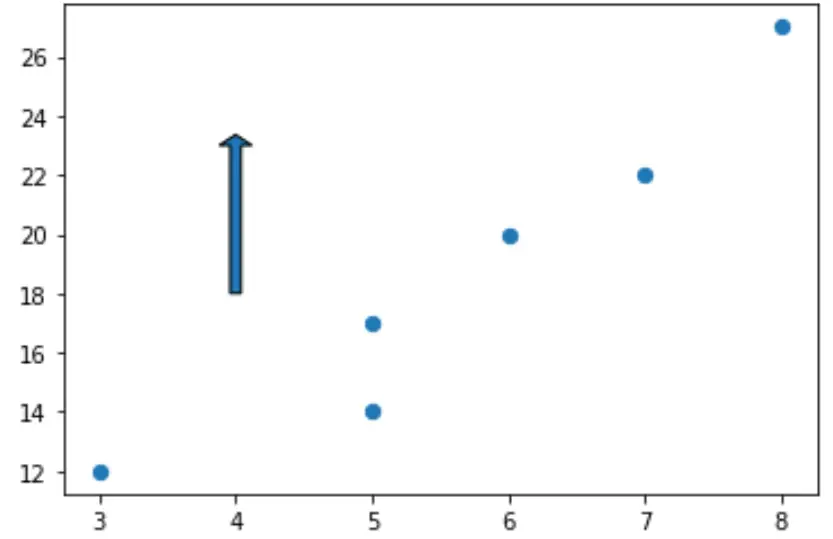
Nota che possiamo impostare dx=0 per creare una freccia verticale e dy=0 per creare una freccia orizzontale.
Ad esempio, ecco come creare una freccia verticale:
 import matplotlib. pyplot as plt

#define two arrays for plotting
A = [3, 5, 5, 6, 7, 8]
B = [12, 14, 17, 20, 22, 27]

#create scatterplot, specifying marker size to be 40
plt. scatter (A, B, s= 40 )

#add arrow to plot
plt. arrow (x= 4 , y= 18 , dx= 0 , dy= 5 , width= .08 )

#displayplot
plt. show ()
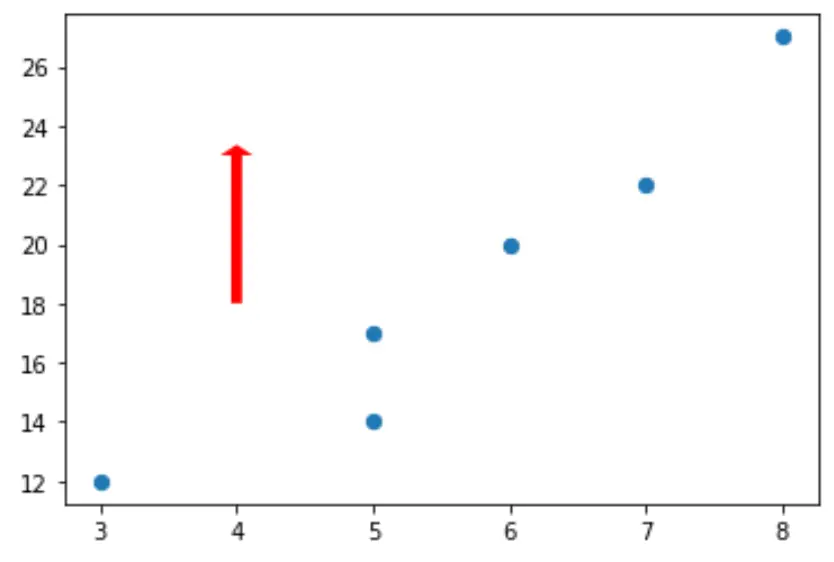
Esempio 2: styling di una freccia
Per impostazione predefinita, una freccia in Matplotlib è blu con bordi neri ma possiamo facilmente modificarla utilizzando gli argomenti facecolor e edgecolor :
 import matplotlib. pyplot as plt

#define two arrays for plotting
A = [3, 5, 5, 6, 7, 8]
B = [12, 14, 17, 20, 22, 27]

#create scatterplot, specifying marker size to be 40
plt. scatter (A, B, s= 40 )

#add arrow to plot
plt. arrow (x= 4 , y= 18 , dx= 0 , dy= 5 , width= .08 , facecolor= 'red' , edgecolor= 'none' )

#displayplot
plt. show ()
Puoi trovare un elenco completo delle proprietà di stile che possono essere applicate alle frecce qui .
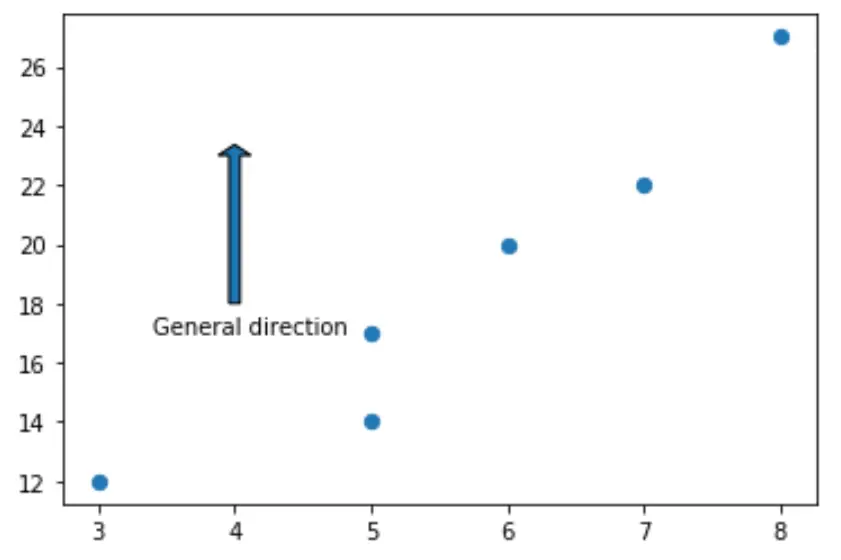
Esempio 3: aggiungere annotazioni alle frecce
Il codice seguente mostra come aggiungere un’annotazione sotto una freccia su un grafico Matplotlib:
 import matplotlib. pyplot as plt

#define two arrays for plotting
A = [3, 5, 5, 6, 7, 8]
B = [12, 14, 17, 20, 22, 27]

#create scatterplot, specifying marker size to be 40
plt. scatter (A, B, s= 40 )

#add arrow to plot
plt. arrow (x= 4 , y= 18 , dx= 0 , dy= 5 , width= .08 )

#add annotation
plt. annotate (' General direction ', xy = (3.4, 17))

#displayplot
plt. show ()
Risorse addizionali
Come tracciare cerchi in Matplotlib (con esempi)
Come disegnare rettangoli in Matplotlib (con esempi)
Informazioni sull'autore
Benjamin anderson
Ciao, sono Benjamin, un professore di statistica in pensione diventato insegnante dedicato di Statorials. Con una vasta esperienza e competenza nel campo della statistica, sono ansioso di condividere le mie conoscenze per potenziare gli studenti attraverso Statorials. Scopri di più