Come usare hjust e spostare semplicemente gli elementi in ggplot2
Puoi utilizzare gli argomenti hjust e vjust per spostare gli elementi rispettivamente orizzontalmente e verticalmente in ggplot2.
Gli esempi seguenti mostrano come utilizzare hjust e vjust in diversi scenari.
Esempio 1: sposta la posizione del titolo in ggplot2
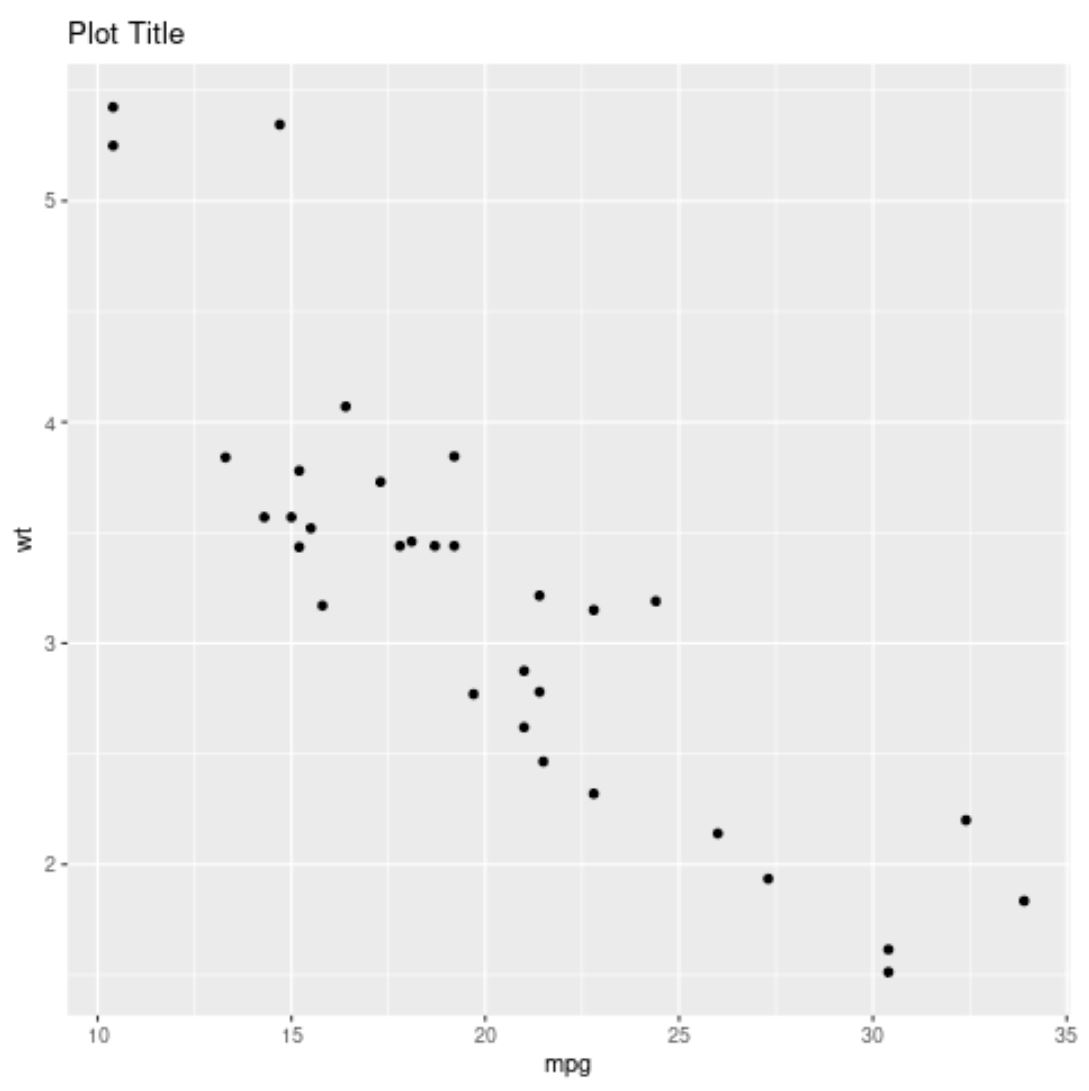
Il codice seguente mostra come creare un grafico a dispersione in ggplot2 con un titolo nella posizione predefinita (allineato a sinistra):
 library (ggplot2)

#create scatter plot with title in default position
ggplot(data=mtcars, aes(x=mpg, y=wt)) +
  geom_point() +
  ggtitle(" Plot Title ")
E il codice seguente mostra come centrare il titolo usando hjust=0.5 :
 library (ggplot2)

#create scatter plot with title center-aligned
ggplot(data=mtcars, aes(x=mpg, y=wt)) +
  geom_point() +
  ggtitle(" Plot Title ") +
  theme(plot. title = element_text(hjust= .5 ))
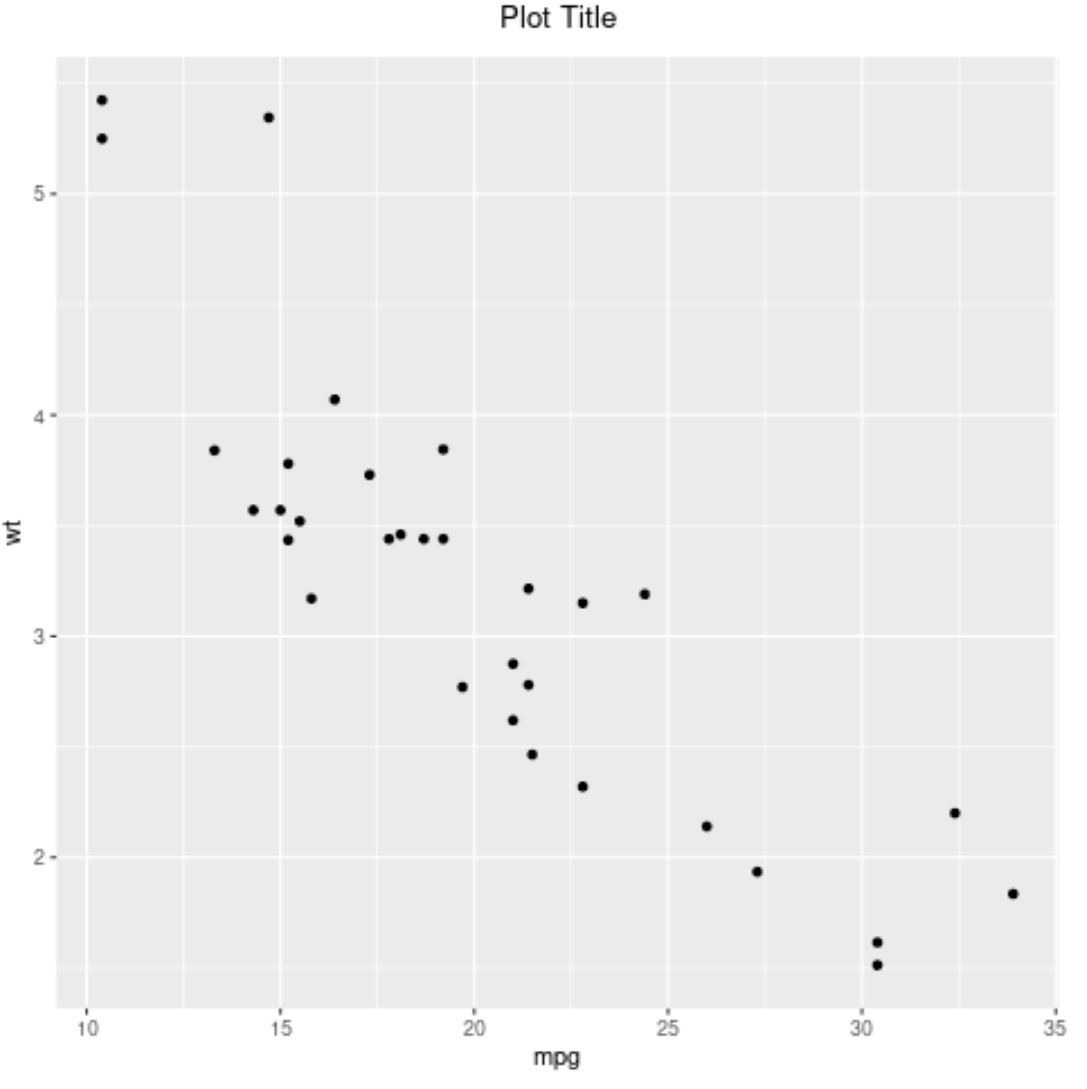
Nota : puoi anche usare hjust=1 per allineare il titolo a destra.
Esempio 2: spostare la posizione dell’etichetta dell’asse in ggplot2
Il codice seguente mostra come creare un grafico a barre in ggplot2 in cui le etichette dell’asse x vengono ruotate di 90 gradi per renderle più facili da leggere:
 library (ggplot2)

#create data frame
df = data. frame (team=c('The Amazing Amazon Anteaters',
                       'The Rowdy Racing Raccoons',
                       'The Crazy Camping Cobras'),
                dots=c(14, 22, 11))

#create bar plot to visualize points scored by each team
ggplot(data=df, aes(x=team, y=points)) +
  geom_bar(stat=' identity ') +
  theme(axis. text . x = element_text(angle= 90 ))
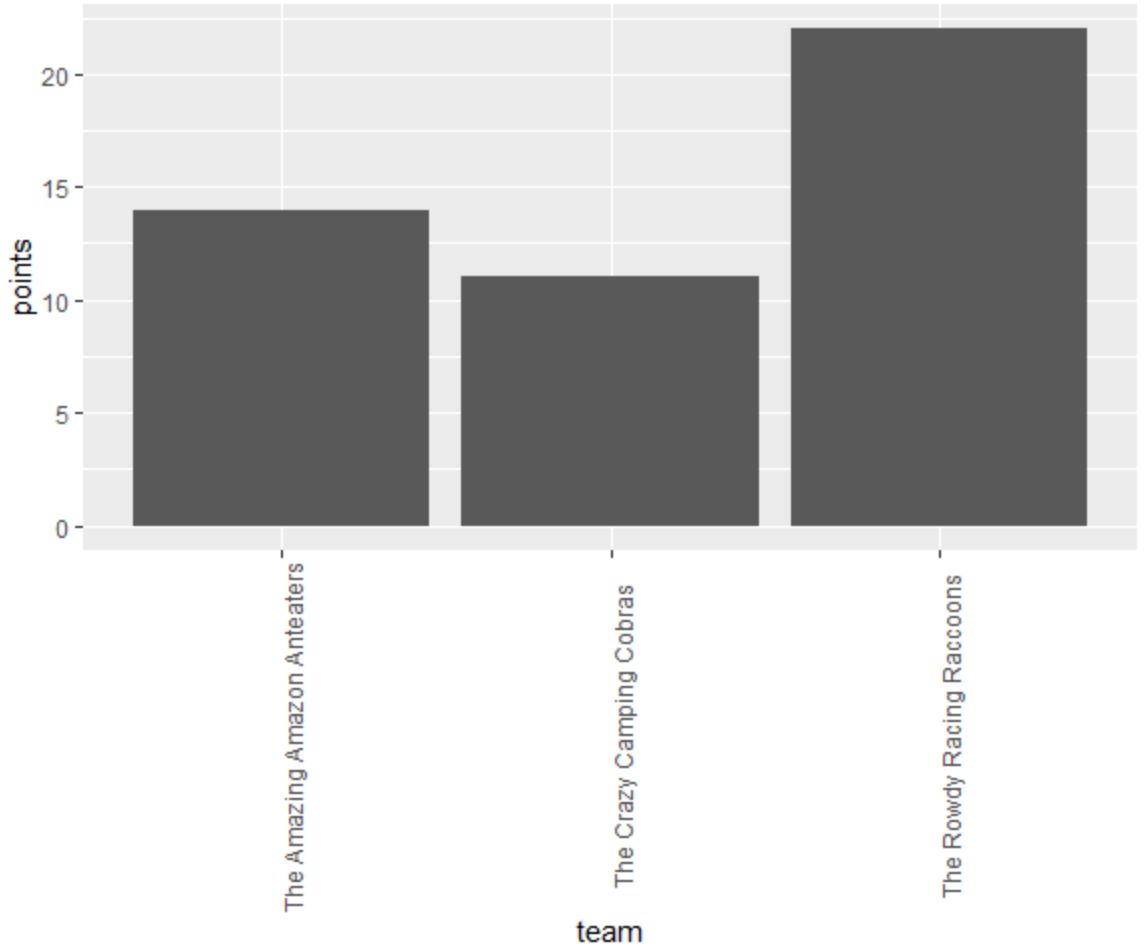
Possiamo usare gli argomenti hjust e vjust per regolare le etichette dell’asse x in modo che si allineino più strettamente con i segni di graduazione dell’asse x:
 library (ggplot2)

#create data frame
df = data. frame (team=c('The Amazing Amazon Anteaters',
                       'The Rowdy Racing Raccoons',
                       'The Crazy Camping Cobras'),
                dots=c(14, 22, 11))

#create bar plot to visualize points scored by each team
ggplot(data=df, aes(x=team, y=points)) +
  geom_bar(stat=' identity ') +
  theme(axis. text . x = element_text(angle= 90 , vjust= .5 , hjust= 1 )

Esempio 3: sposta la posizione del testo in ggplot2
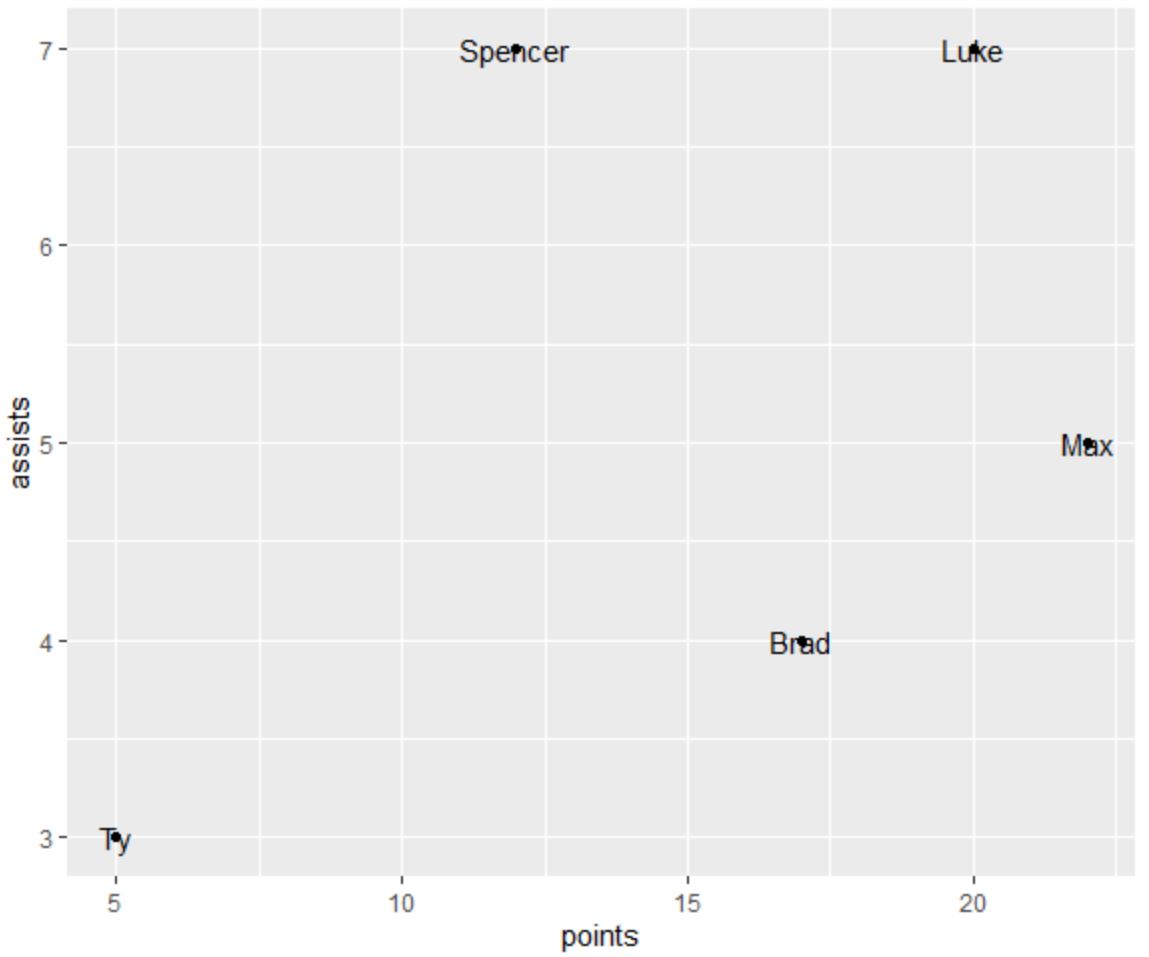
Il codice seguente mostra come creare un grafico a dispersione in ggplot2 con testo annotato per ogni punto del grafico:
 library (ggplot2)

#create data frame
df <- data. frame (player=c('Brad', 'Ty', 'Spencer', 'Luke', 'Max'),
                 dots=c(17, 5, 12, 20, 22),
                 assists=c(4, 3, 7, 7, 5))

#create scatter plot with annotated labels
ggplot(df) +
  geom_point(aes(x=points, y=assists)) +
  geom_text(aes(x=points, y=assists, label=player))
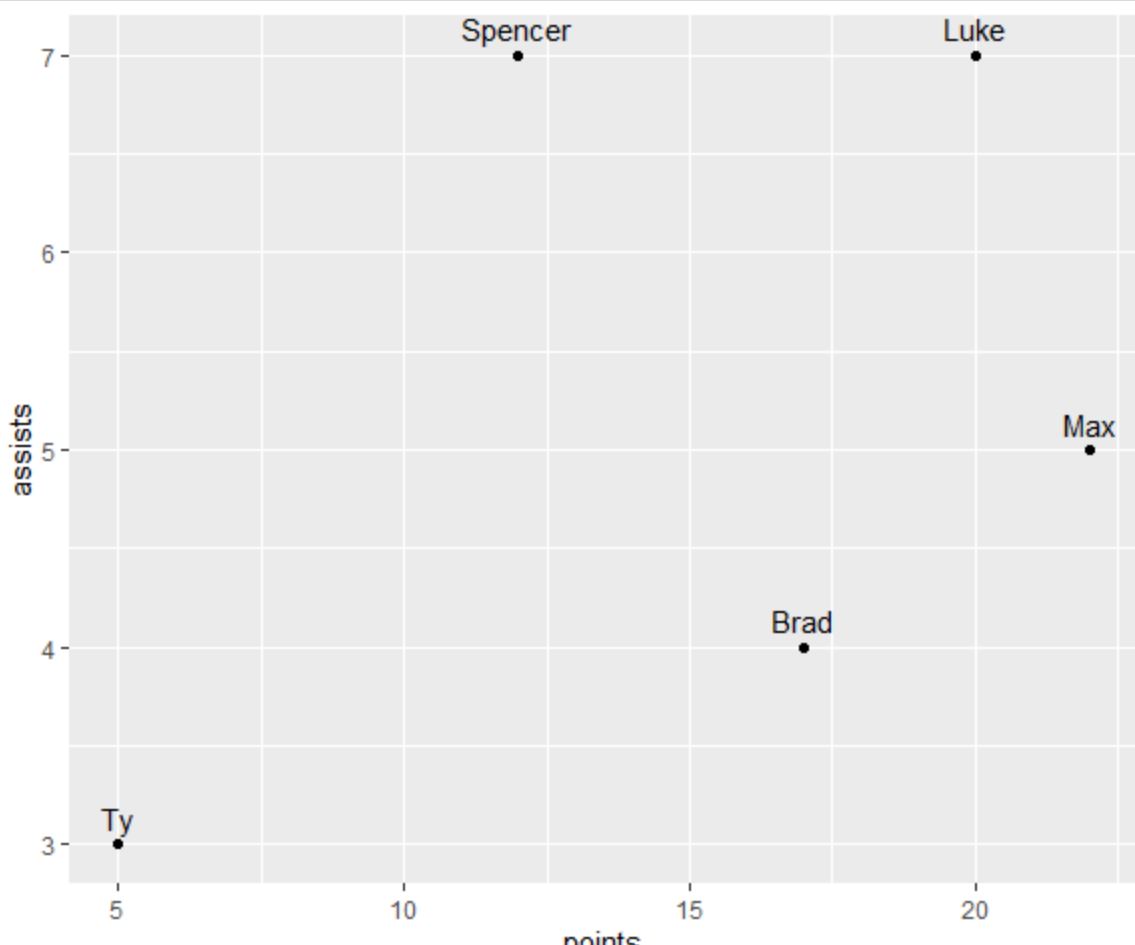
Possiamo usare l’argomento vjust per spostare verticalmente gli elementi di testo in modo che siano più facili da leggere:
 library (ggplot2)

#create data frame
df <- data. frame (player=c('Brad', 'Ty', 'Spencer', 'Luke', 'Max'),
                 dots=c(17, 5, 12, 20, 22),
                 assists=c(4, 3, 7, 7, 5))

#create scatter plot with annotated labels
ggplot(df) +
  geom_point(aes(x=points, y=assists)) +
  geom_text(aes(x=points, y=assists, label=player), vjust= -.6 )
Potremmo anche usare un valore positivo per vjust per spostare gli elementi di testo verticalmente verso il basso:
 library (ggplot2)

#create data frame
df <- data. frame (player=c('Brad', 'Ty', 'Spencer', 'Luke', 'Max'),
                 dots=c(17, 5, 12, 20, 22),
                 assists=c(4, 3, 7, 7, 5))

#create scatter plot with annotated labels
ggplot(df) +
  geom_point(aes(x=points, y=assists)) +
  geom_text(aes(x=points, y=assists, label=player), vjust= 1.2 )
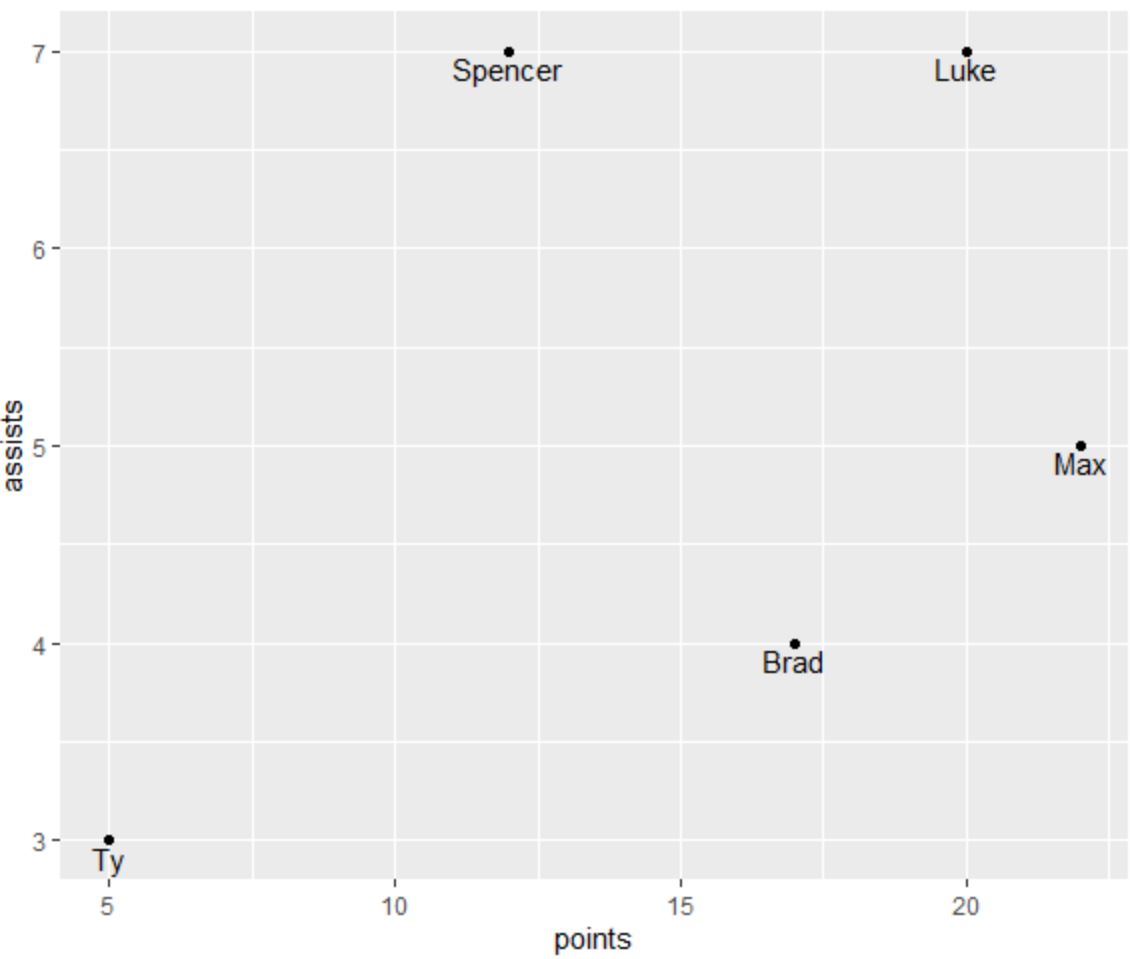
Il testo annotato si trova ora sotto ogni punto della trama.
Risorse addizionali
I seguenti tutorial spiegano come eseguire altre attività comuni in ggplot2:
Come cambiare il titolo della legenda in ggplot2
Come ruotare le etichette degli assi in ggplot2
Come risolvere il problema in R: Impossibile trovare la funzione “ggplot”
Informazioni sull'autore
Benjamin anderson
Ciao, sono Benjamin, un professore di statistica in pensione diventato insegnante dedicato di Statorials. Con una vasta esperienza e competenza nel campo della statistica, sono ansioso di condividere le mie conoscenze per potenziare gli studenti attraverso Statorials. Scopri di più