Come creare un grafico ad area in seaborn (con esempi)
È possibile utilizzare la seguente sintassi di base per creare un grafico ad area in Seaborn :
 import matplotlib. pyplot as plt
import seaborn as sns

#set seaborn style
sns. set_theme ()

#create seaborn area chart
plt. stackplot ( df.x , df.y1 , df.y2 , df.y3 )
Gli esempi seguenti mostrano come utilizzare questa sintassi nella pratica.
Esempio 1: creare un grafico ad area di base in Seaborn
Il codice seguente mostra come creare un grafico ad area di base in Seaborn:
 import pandas as pd
import matplotlib. pyplot as plt
import seaborn as sns

#set seaborn style
sns. set_theme ()

#define DataFrame
df = pd. DataFrame ({' period ': [1, 2, 3, 4, 5, 6, 7, 8],
                   ' team_A ': [20, 12, 15, 14, 19, 23, 25, 29],
                   ' team_B ': [5, 7, 7, 9, 12, 9, 9, 4],
                   ' team_C ': [11, 8, 10, 6, 6, 5, 9, 12]})

#create area chart
plt. stackplot (df. period , df. team_A , df. team_B , df. team_C )
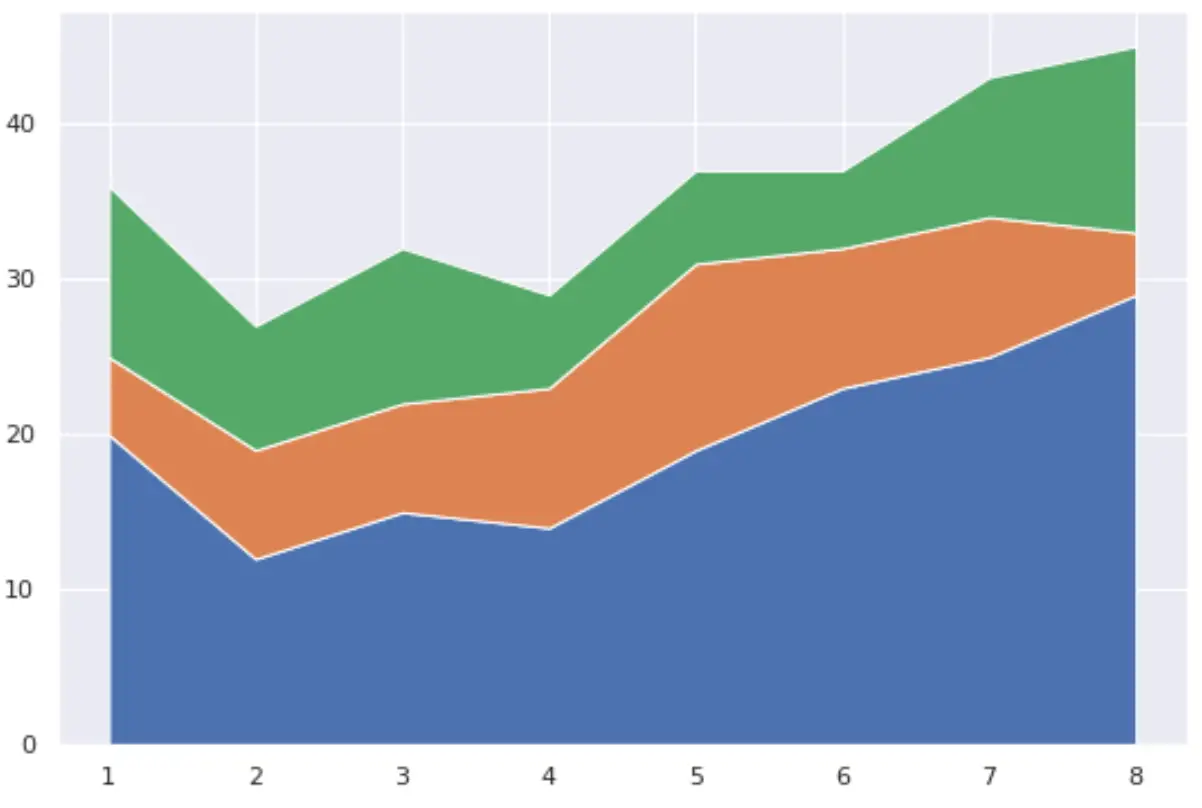
L’asse x mostra la variabile periodo e l’asse y mostra i valori per ciascuna delle tre squadre nel tempo.
Esempio 2: creare un grafico ad area personalizzato in Seaborn
Il codice seguente mostra come modificare i colori del grafico ad area e aggiungere una legenda con etichette specifiche:
 import pandas as pd
import matplotlib. pyplot as plt
import seaborn as sns

#set seaborn style
sns. set_theme ()

#define DataFrame
df = pd. DataFrame ({' period ': [1, 2, 3, 4, 5, 6, 7, 8],
                   ' team_A ': [20, 12, 15, 14, 19, 23, 25, 29],
                   ' team_B ': [5, 7, 7, 9, 12, 9, 9, 4],
                   ' team_C ': [11, 8, 10, 6, 6, 5, 9, 12]})

#define colors to use in chart
color_map = [' red ', ' steelblue ', ' pink ']

#create area chart
plt. stackplot (df. period , df. team_A , df. team_B , df. team_C ,
              labels=[' Team A ', ' Team B ', ' Team C '],
              colors=color_map)

#add legend
plt. legend (loc=' upper left ')

#add axis labels
plt. xlabel (' Period ')
plt. ylabel (' Points Scored ')

#display area chart
plt. show ()
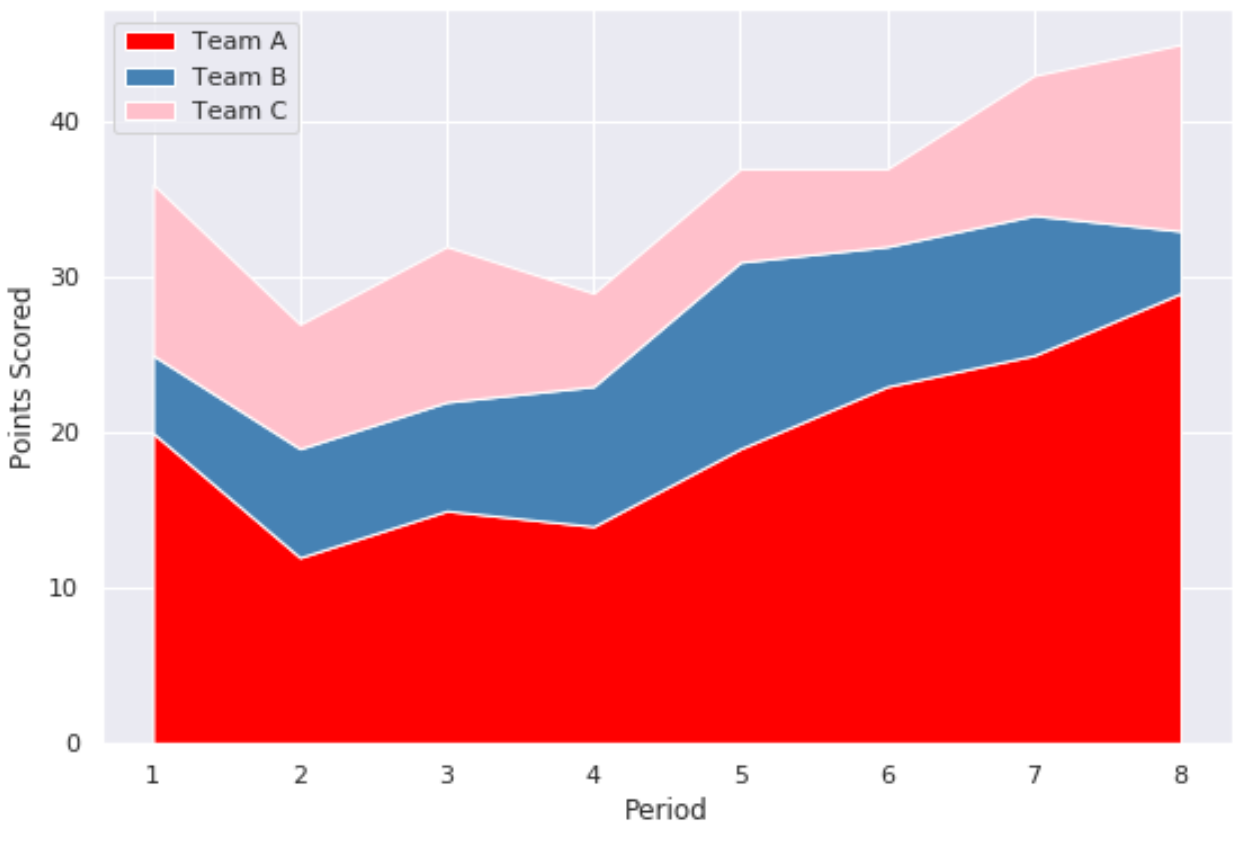
Tieni presente che l’argomento colori accetta nomi di colori e codici colore esadecimali.
Risorse addizionali
I seguenti tutorial spiegano come creare altre trame comuni in Seaborn:
Come creare un grafico di serie temporali in Seaborn
Come creare un grafico a torta in Seaborn
Come creare un barplot in Seaborn
Informazioni sull'autore
Benjamin anderson
Ciao, sono Benjamin, un professore di statistica in pensione diventato insegnante dedicato di Statorials. Con una vasta esperienza e competenza nel campo della statistica, sono ansioso di condividere le mie conoscenze per potenziare gli studenti attraverso Statorials. Scopri di più