Come utilizzare tight_layout() in matplotlib
È possibile utilizzare la funzione Tight_layout() in Matplotlib per regolare automaticamente il riempimento tra e attorno alle sottotrame.
L’esempio seguente mostra come utilizzare questa funzione nella pratica.
Esempio: come utilizzare Tight_layout() in Matplotlib
Supponiamo di utilizzare Matplotilb per creare quattro sottotrame in una griglia 2×2:
 import matplotlib. pyplot as plt

#define data
x = [1, 2, 3]
y = [7, 13, 24]

#define layout for subplots
fig, ax = plt. subplots (2, 2)

#define subplot titles
ax[0, 0]. plot (x,y,color=' red ')
ax[0, 1]. plot (x,y,color=' blue ')
ax[1, 0]. plot (x,y,color=' green ')
ax[1, 1]. plot (x,y,color=' purple ')

#add title to each subplot
ax[0, 0]. set_title (' First Subplot ')
ax[0, 1]. set_title (' Second Subplot ')
ax[1, 0]. set_title (' Third Subplot ')
ax[1, 1]. set_title (' Fourth Subplot ')
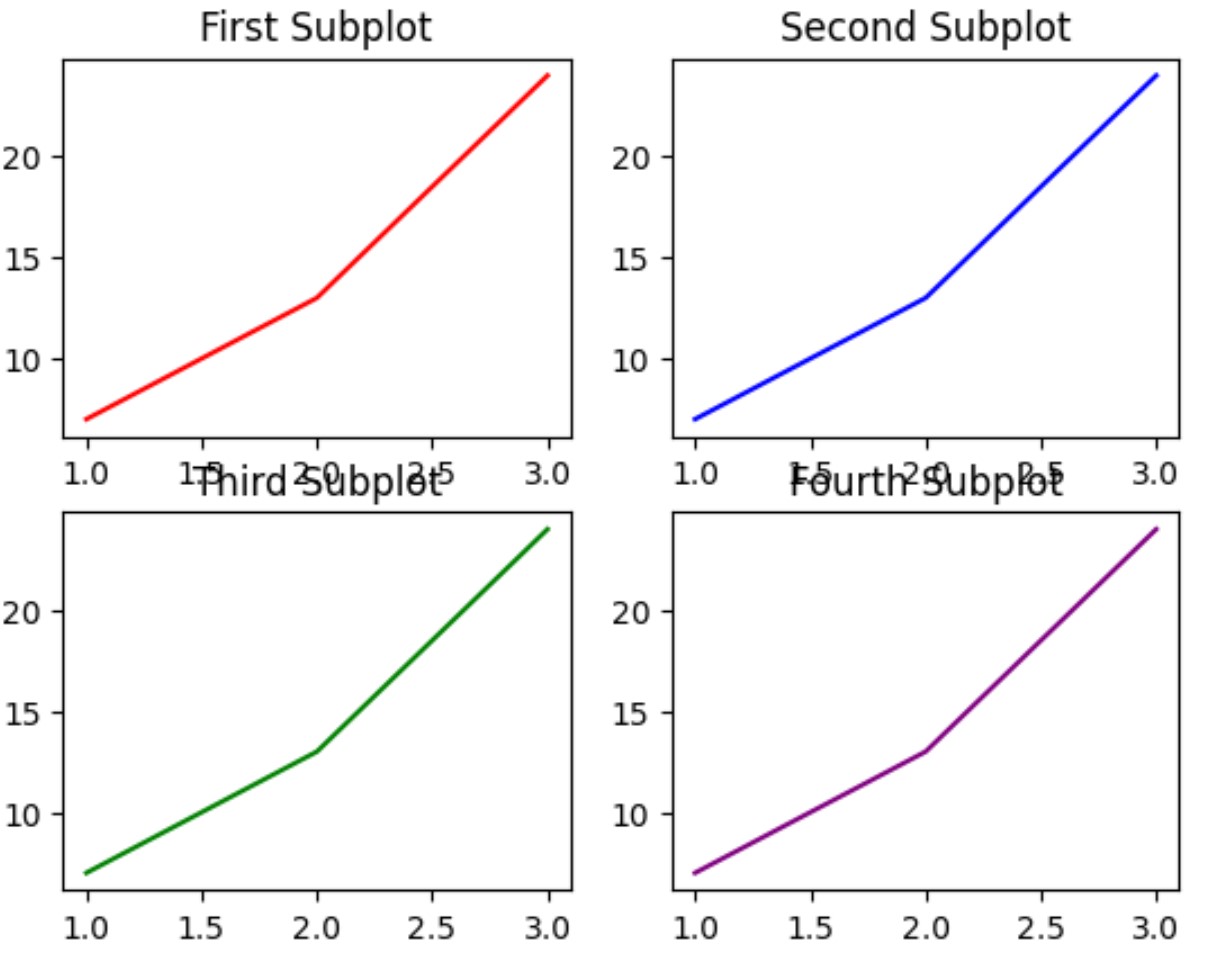
Tieni presente che l’imbottitura tra le sottotrame è minima, con conseguente sovrapposizione dei titoli in alcuni punti.
Specificando fig.tight_layout() possiamo regolare automaticamente il riempimento tra e attorno alle sottotrame:
 import matplotlib. pyplot as plt

#define data
x = [1, 2, 3]
y = [7, 13, 24]

#define layout for subplots
fig, ax = plt. subplots (2, 2)

#specify a tight layout
fig. tight_layout ()

#define subplot titles
ax[0, 0]. plot (x,y,color=' red ')
ax[0, 1]. plot (x,y,color=' blue ')
ax[1, 0]. plot (x,y,color=' green ')
ax[1, 1]. plot (x,y,color=' purple ')

#add title to each subplot
ax[0, 0]. set_title (' First Subplot ')
ax[0, 1]. set_title (' Second Subplot ')
ax[1, 0]. set_title (' Third Subplot ')
ax[1, 1]. set_title (' Fourth Subplot ')
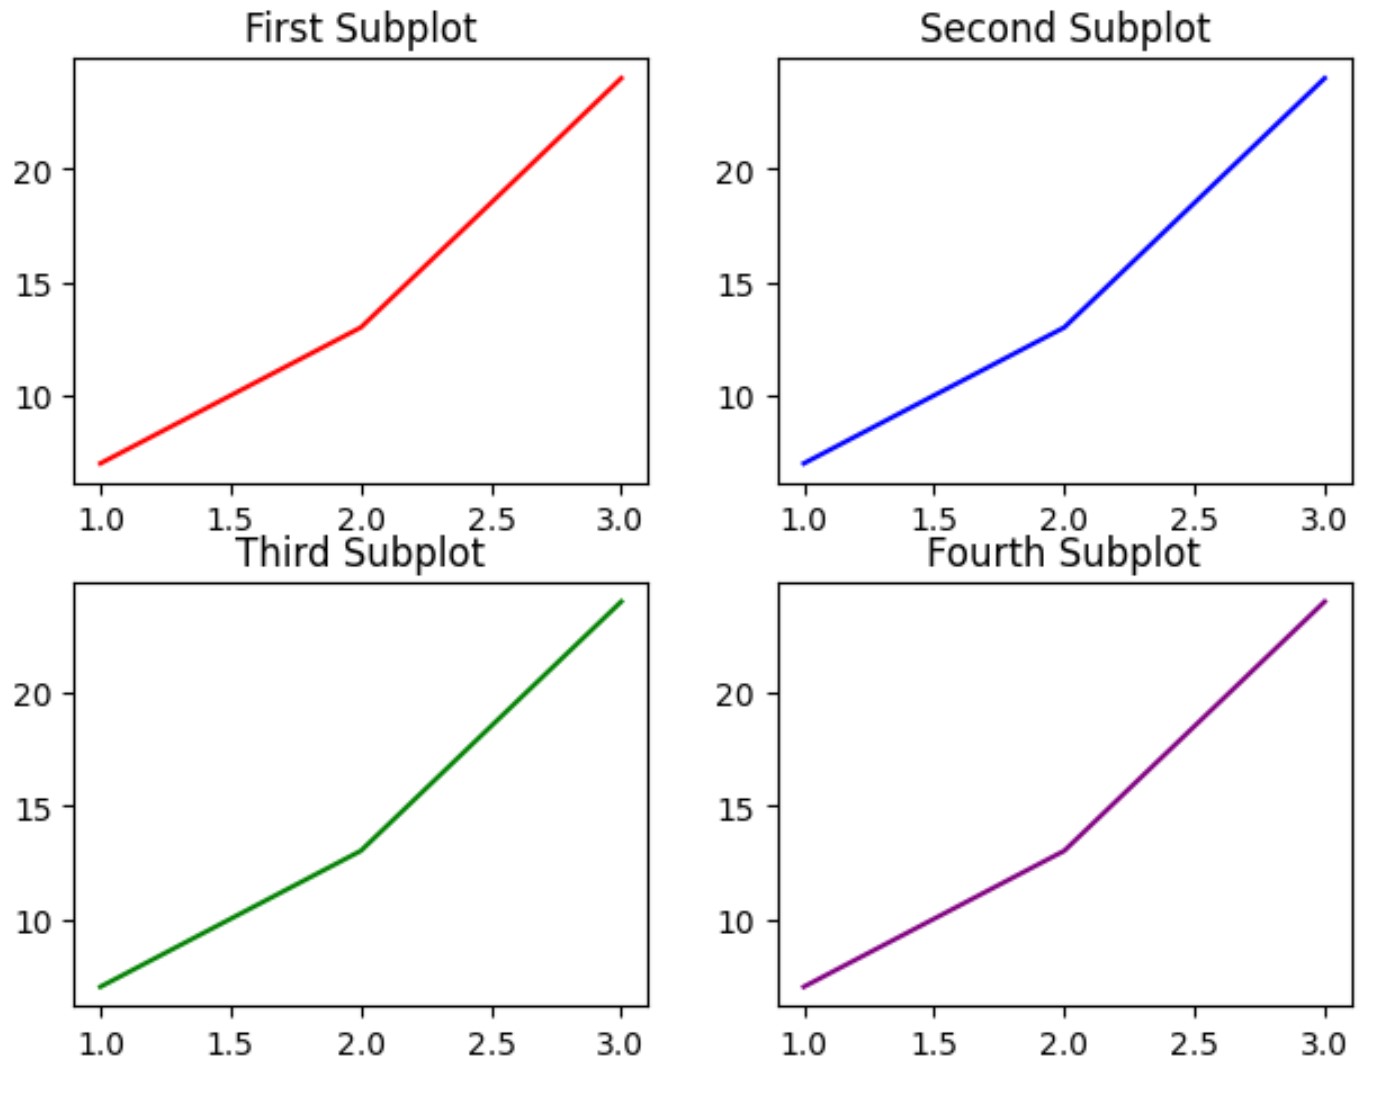
Tieni presente che il riempimento tra e attorno alle sottotrame è stato regolato in modo che le trame non si sovrappongano più in nessuna area.
Si noti che la funzione Tight_layout() accetta un argomento pad per specificare il riempimento tra il bordo della figura e i bordi del sottopercorso, come frazione della dimensione del carattere.
Il valore del pad predefinito è 1.08 . Tuttavia, possiamo aumentare questo valore per aumentare il riempimento attorno ai percorsi:
 import matplotlib. pyplot as plt

#define data
x = [1, 2, 3]
y = [7, 13, 24]

#define layout for subplots
fig, ax = plt. subplots (2, 2)

#specify a tight layout with increased padding
fig. tight_layout (pad=5)

#define subplot titles
ax[0, 0]. plot (x,y,color=' red ')
ax[0, 1]. plot (x,y,color=' blue ')
ax[1, 0]. plot (x,y,color=' green ')
ax[1, 1]. plot (x,y,color=' purple ')

#add title to each subplot
ax[0, 0]. set_title (' First Subplot ')
ax[0, 1]. set_title (' Second Subplot ')
ax[1, 0]. set_title (' Third Subplot ')
ax[1, 1]. set_title (' Fourth Subplot ')
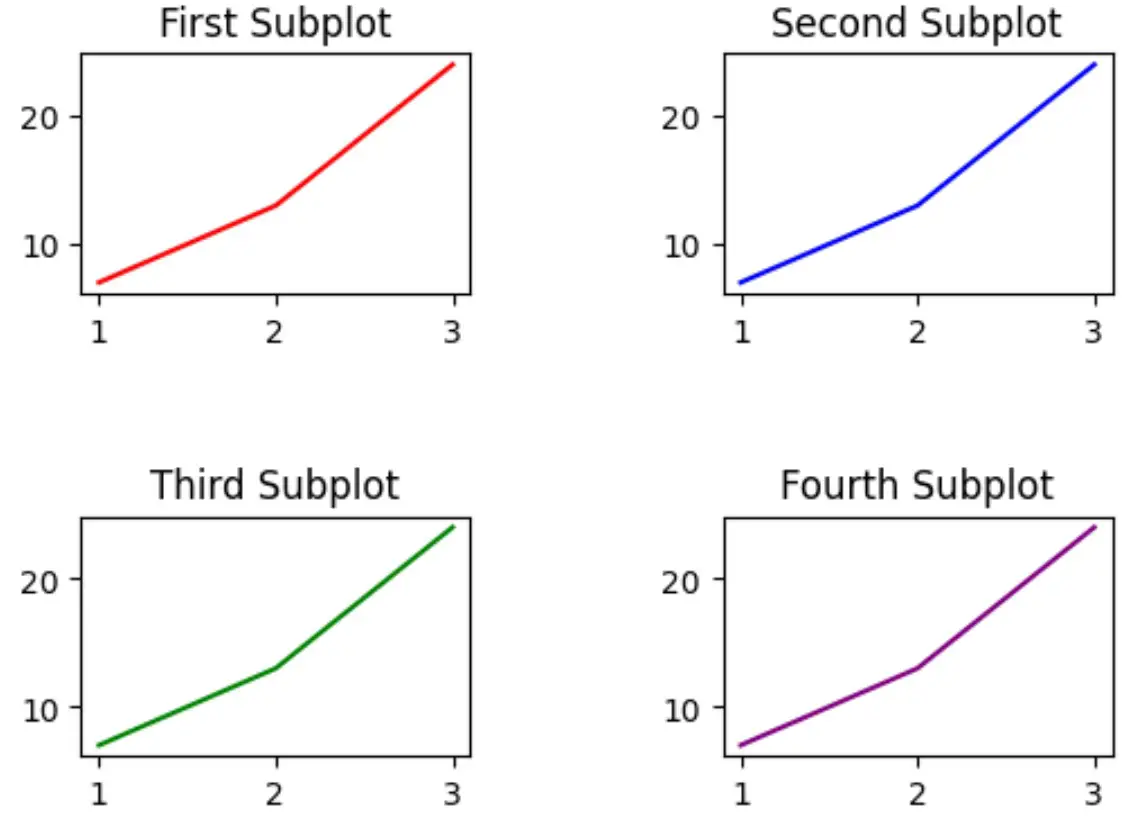
Si noti che il riempimento attorno ai lotti è aumentato notevolmente.
Sentiti libero di regolare il valore dell’argomento pad per aumentare quanto vuoi il riempimento attorno ai percorsi.
Risorse addizionali
I seguenti tutorial spiegano come eseguire altre attività comuni in Matplotlib:
Come aggiungere un titolo alle sottotrame in Matplotlib
Come regolare la dimensione della sottotrama in Matplotlib
Come regolare la spaziatura tra le sottotrame Matplotlib
Informazioni sull'autore
Benjamin anderson
Ciao, sono Benjamin, un professore di statistica in pensione diventato insegnante dedicato di Statorials. Con una vasta esperienza e competenza nel campo della statistica, sono ansioso di condividere le mie conoscenze per potenziare gli studenti attraverso Statorials. Scopri di più