Come aggiungere testo ai grafici matplotlib (con esempi)
Puoi aggiungere facilmente testo a un grafico Matplotlib utilizzando la funzione matplotlib.pyplot.text() , che utilizza la seguente sintassi:
matplotlib.pyplot.text(x, y, s, fontdict=None)
Oro:
- x: la coordinata x del testo
- y: la coordinata y del testo
- s: la stringa di testo
- fontdict: un dizionario per sovrascrivere le proprietà di testo predefinite
Questo tutorial mostra diversi esempi di utilizzo pratico di questa funzione.
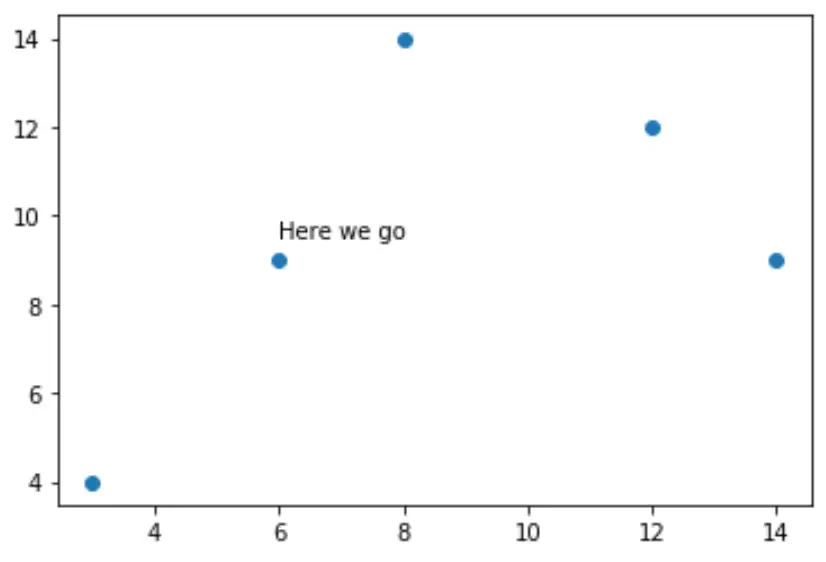
Esempio 1: aggiungi testo univoco a un grafico Matplotlib
Il codice seguente mostra come creare un grafico a dispersione e aggiungere un singolo pezzo di testo al grafico:
 import matplotlib. pyplot as plt

#createdata
x = [3, 6, 8, 12, 14]
y = [4, 9, 14, 12, 9]

#create scatterplot
plt. scatter (x,y)

#add text at (x, y) coordinates = (6, 9.5)
plt. text (6, 9.5, ' Here we go ')
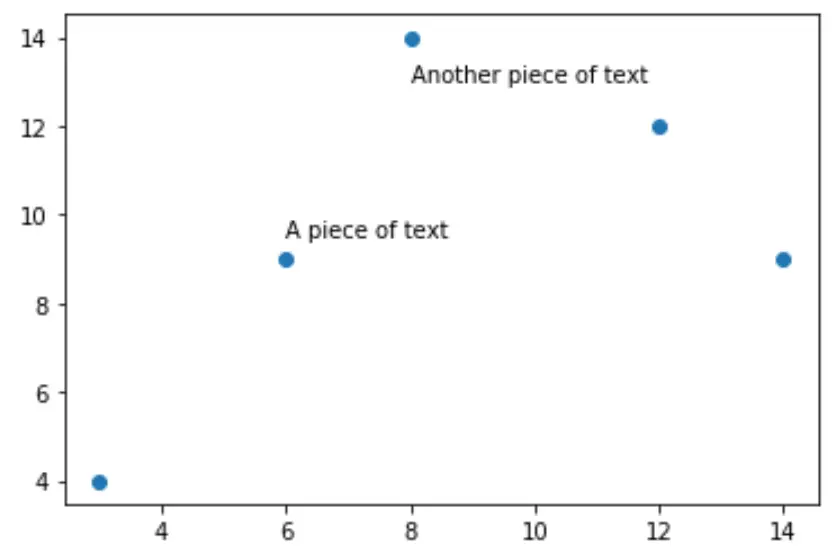
Esempio 2: aggiungi più testi a un grafico Matplotlib
Il codice seguente mostra come creare un grafico a dispersione e aggiungere più parti di testo al grafico:
 import matplotlib. pyplot as plt

#create data
x = [3, 6, 8, 12, 14]
y = [4, 9, 14, 12, 9]

#create scatterplot
plt. scatter (x,y)

#add text at (x, y) coordinates = (6, 9.5)
plt. text (6, 9.5, ' A piece of text ')

#add another piece of text
plt. text (8, 13, ' Another piece of text ')
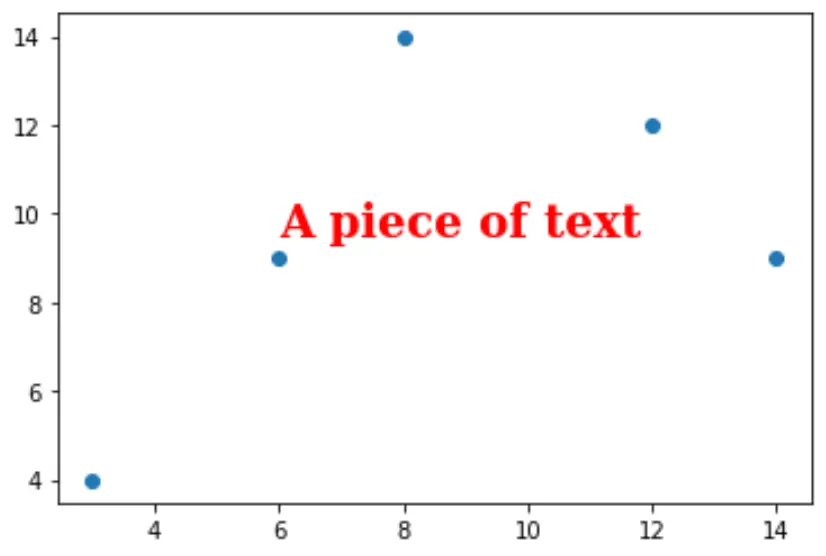
Esempio 3: modificare le proprietà del testo
Per modificare le proprietà del testo, possiamo creare un dizionario che specifica le proprietà del carattere.
Il codice seguente mostra come eseguire questa operazione:
 import matplotlib. pyplot as plt

#createdata
x = [3, 6, 8, 12, 14]
y = [4, 9, 14, 12, 9]

#create scatterplot
plt. scatter (x,y)

font = {' family ': ' serif ',
        ' color ': ' red ',
        ' weight ': ' bold ',
        ' size ': 20
        }

#add text with custom font
plt. text (6, 9.5, ' A piece of text ', fontdict=font)
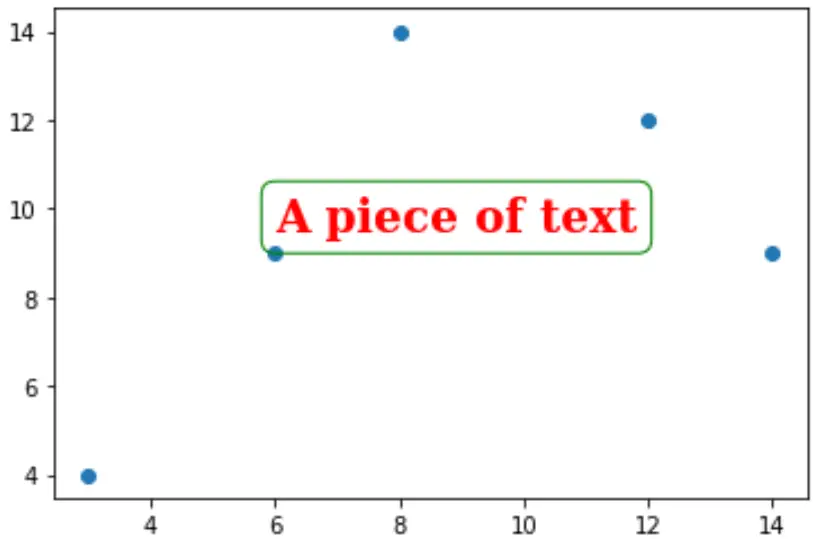
Esempio 4: aggiungi una cornice attorno al testo
Il codice seguente mostra come aggiungere una cornice attorno al testo:
 import matplotlib. pyplot as plt

#createdata
x = [3, 6, 8, 12, 14]
y = [4, 9, 14, 12, 9]

#create scatterplot
plt. scatter (x,y)

font = {' family ': ' serif ',
        ' color ': ' red ',
        ' weight ': ' bold ',
        ' size ': 20
        }

box = {' facecolor ': ' none ',
       ' edgecolor ': ' green ',
       ' boxstyle ': ' round '
      }

#add text with custom font
plt. text (6, 9.5, ' A piece of text ', fontdict=font, bbox=box)
Risorse addizionali
Come annotare i grafici a dispersione Matplotlib
Come modificare la dimensione del carattere su un grafico Matplotlib
Informazioni sull'autore
Benjamin anderson
Ciao, sono Benjamin, un professore di statistica in pensione diventato insegnante dedicato di Statorials. Con una vasta esperienza e competenza nel campo della statistica, sono ansioso di condividere le mie conoscenze per potenziare gli studenti attraverso Statorials. Scopri di più