Come tracciare una curva morbida in matplotlib
Spesso potresti voler tracciare una curva uniforme in Matplotlib per un grafico a linee. Fortunatamente, questo è facile da fare utilizzando le seguenti funzioni SciPy:
Questo tutorial spiega come utilizzare queste funzioni nella pratica.
Esempio: tracciare una curva uniforme in Matplotlib
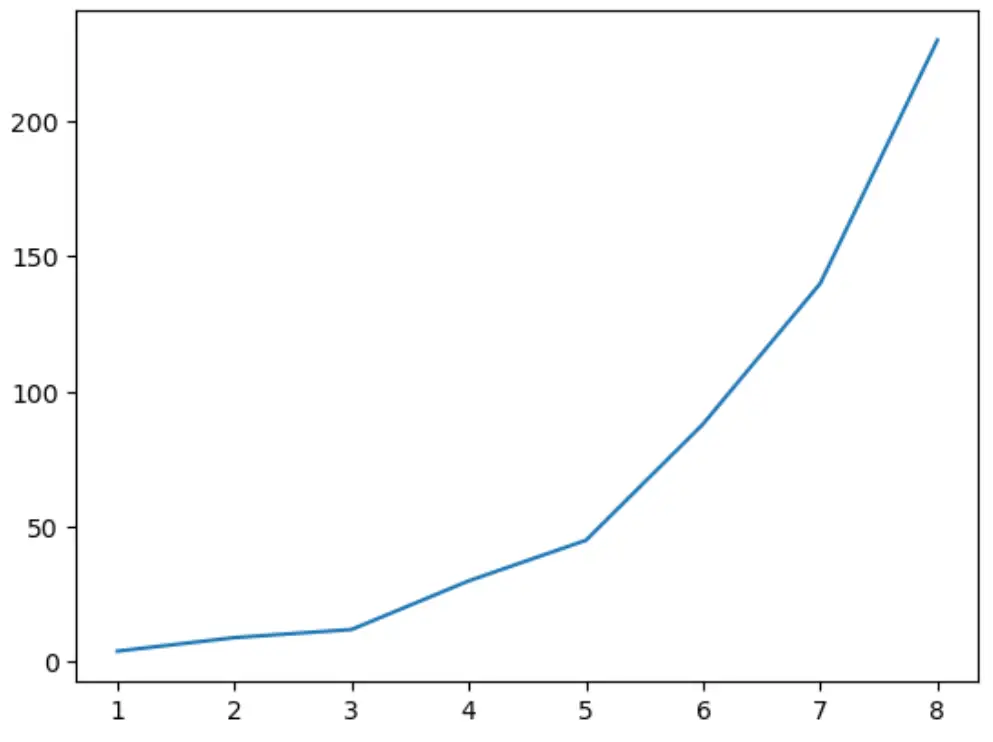
Il codice seguente mostra come creare un grafico a linee semplice per un set di dati:
 import numpy as np
import matplotlib.pyplot as plt

#create data
x = np.array([1, 2, 3, 4, 5, 6, 7, 8])
y = np.array([4, 9, 12, 30, 45, 88, 140, 230])

#create line chart
plt. plot (x,y)
plt. show ()

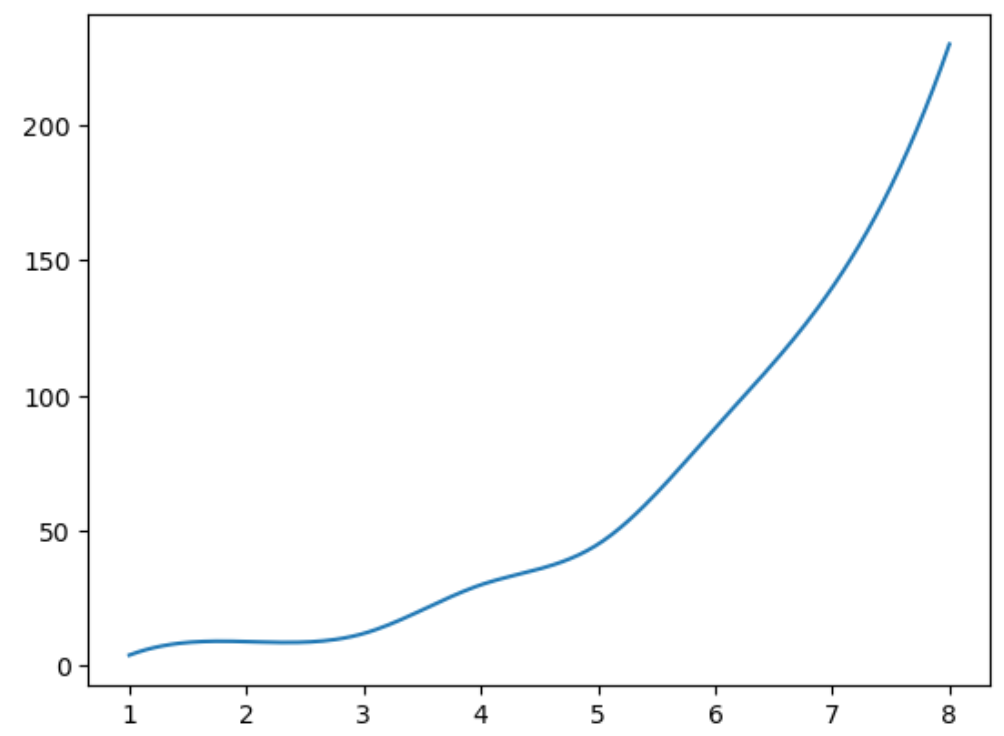
Tieni presente che il grafico a linee non è completamente uniforme poiché i dati sottostanti non seguono una linea uniforme. Possiamo utilizzare il seguente codice per creare una curva uniforme per questo set di dati:
 from scipy.interpolate import make_interp_spline, BSpline

#createdata
x = np.array([1, 2, 3, 4, 5, 6, 7, 8])
y = np.array([4, 9, 12, 30, 45, 88, 140, 230])

#define x as 200 equally spaced values between the min and max of original x
xnew = np. linspace ( x.min (), x.max (), 200 )

#define spline
spl = make_interp_spline (x, y, k= 3 )
y_smooth = spl (xnew)

#create smooth line chart
plt. plot (xnew, y_smooth)
plt. show ()

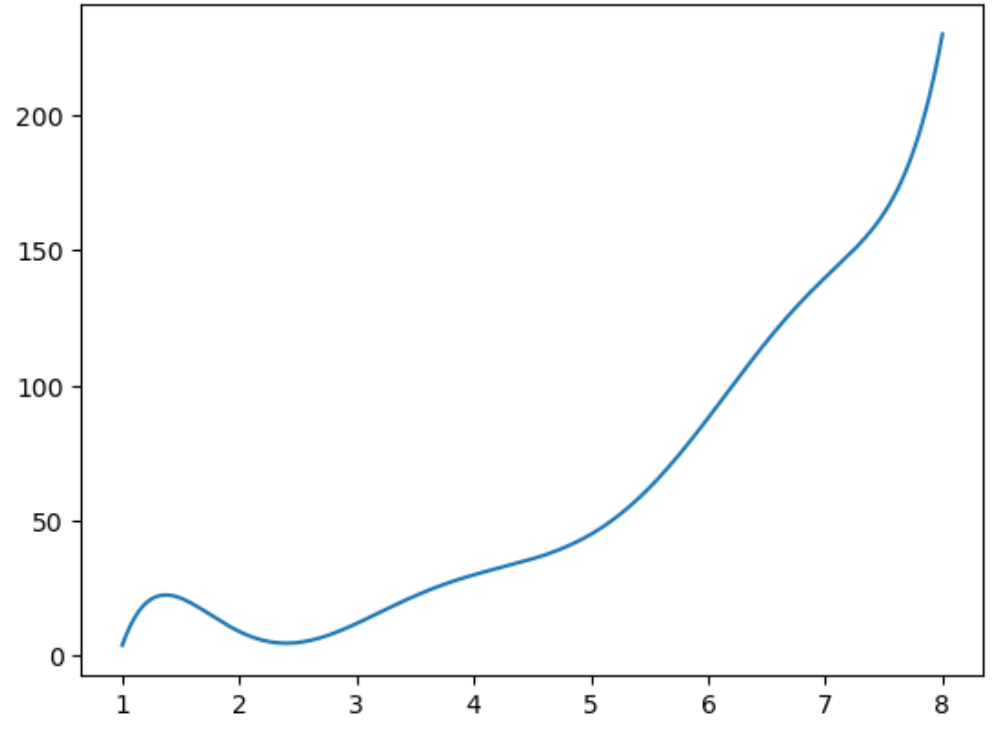
Tieni presente che maggiore è il grado utilizzato per l’argomento k , più “ondulata” sarà la curva. Ad esempio, consideriamo il seguente grafico con k=7 :
 from scipy.interpolate import make_interp_spline, BSpline

#createdata
x = np.array([1, 2, 3, 4, 5, 6, 7, 8])
y = np.array([4, 9, 12, 30, 45, 88, 140, 230])

#define x as 200 equally spaced values between the min and max of original x
xnew = np. linspace ( x.min (), x.max (), 200 )

#define spline with degree k=7
spl = make_interp_spline (x, y, k= 7 )
y_smooth = spl (xnew)

#create smooth line chart
plt. plot (xnew, y_smooth)
plt. show ()

A seconda della curvatura che desideri che abbia la linea, puoi modificare il valore di k.
Risorse addizionali
Come mostrare le griglie sui grafici Matplotlib
Come rimuovere i segni di spunta dai grafici Matplotlib
Come creare grafici Matplotlib con scale logaritmiche