Come creare un boxplot da pandas dataframe
È possibile utilizzare la seguente sintassi per creare boxplot da un DataFrame panda:
 #create boxplot of one column
df. boxplot (column=[' col1 '])

#create boxplot of multiple columns
df. boxplot (column=[' col1 ', ' col2 '])

#create boxplot grouped by one column
df. boxplot (column=[' col1 '], by=' col2 ')
I seguenti esempi mostrano come utilizzare questa sintassi in pratica con il seguente DataFrame:
 import pandas as pd

#createDataFrame
df = pd. DataFrame ({' conference ': ['A', 'A', 'A', 'B', 'B', 'B'],
                   ' points ': [5, 7, 7, 9, 12, 9],
                   ' assists ': [11, 8, 10, 6, 6, 5],
                   ' rebounds ': [4, 2, 5, 8, 6, 11],})

#view DataFrame
df
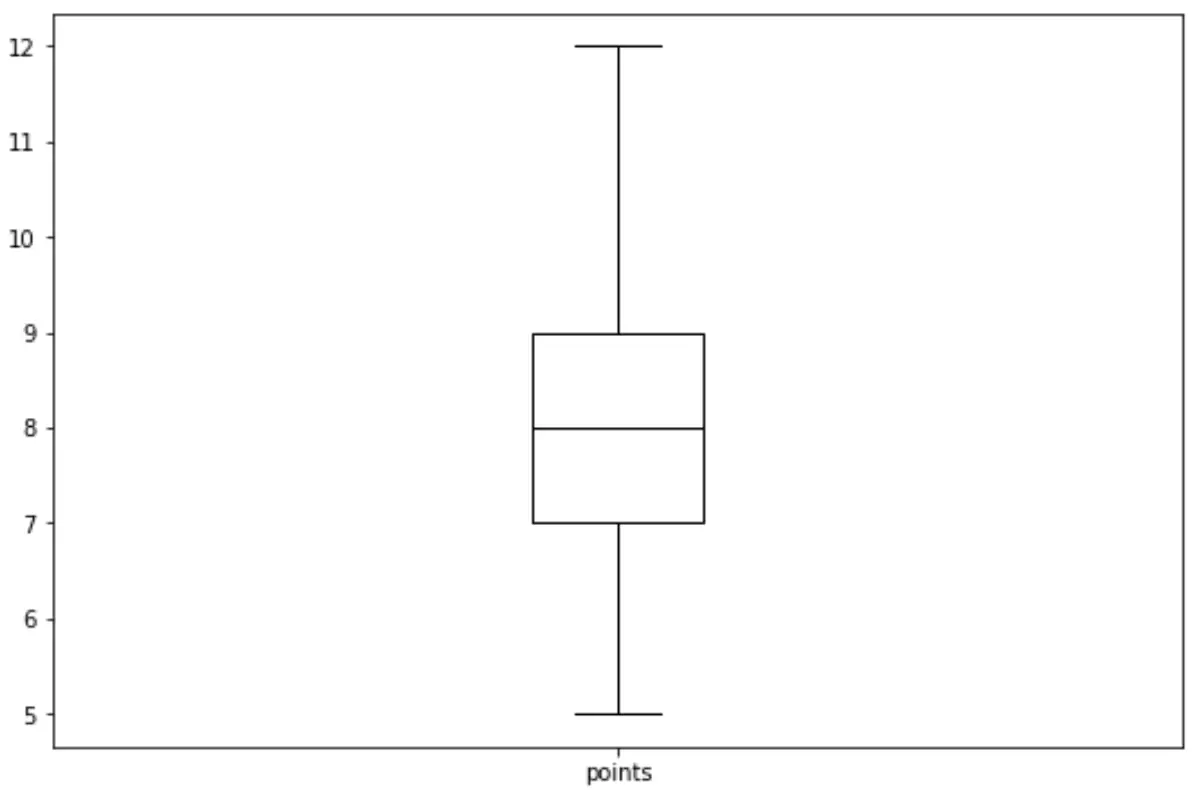
Esempio 1: boxplot di una colonna
Il codice seguente mostra come creare un boxplot per una colonna in un DataFrame panda:
df. boxplot (column=[' points '], grid= False , color=' black ')
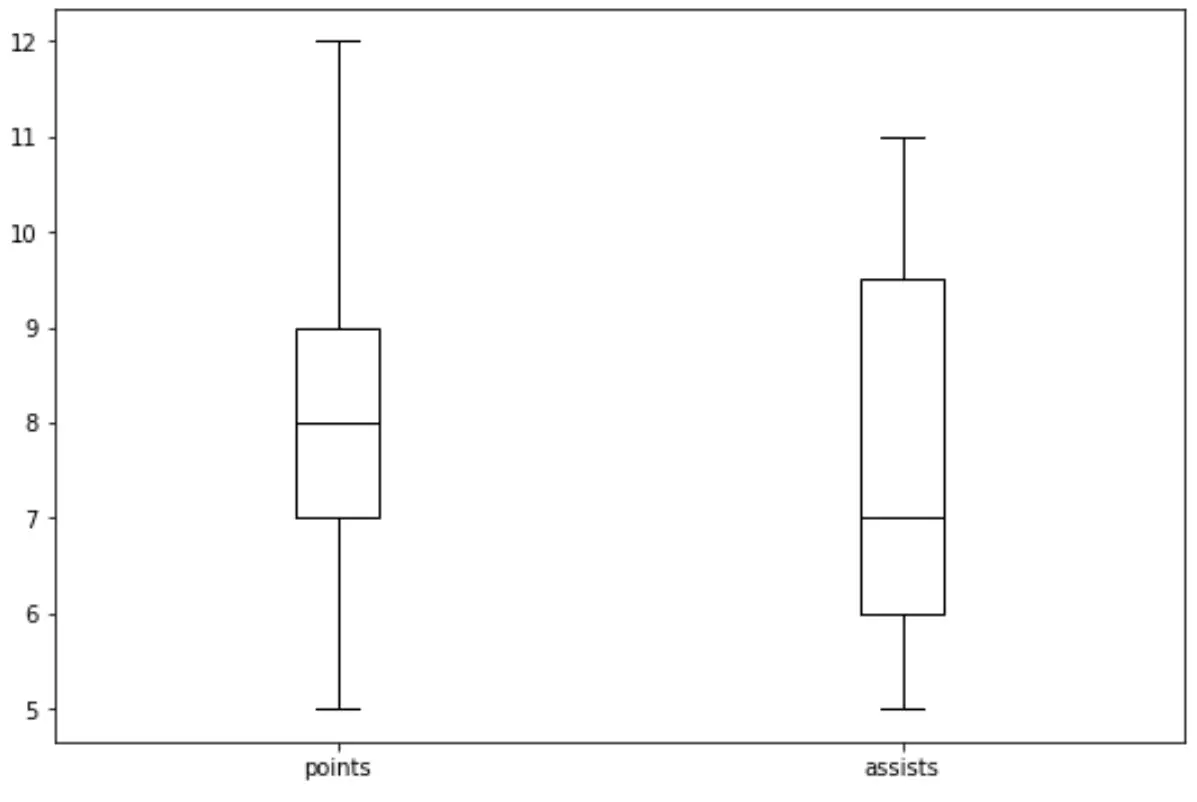
Esempio 2: boxplot di più colonne
Il codice seguente mostra come creare un boxplot per più colonne in un DataFrame panda:
df. boxplot (column=[' points ', ' assists '], grid= False , color=' black ')
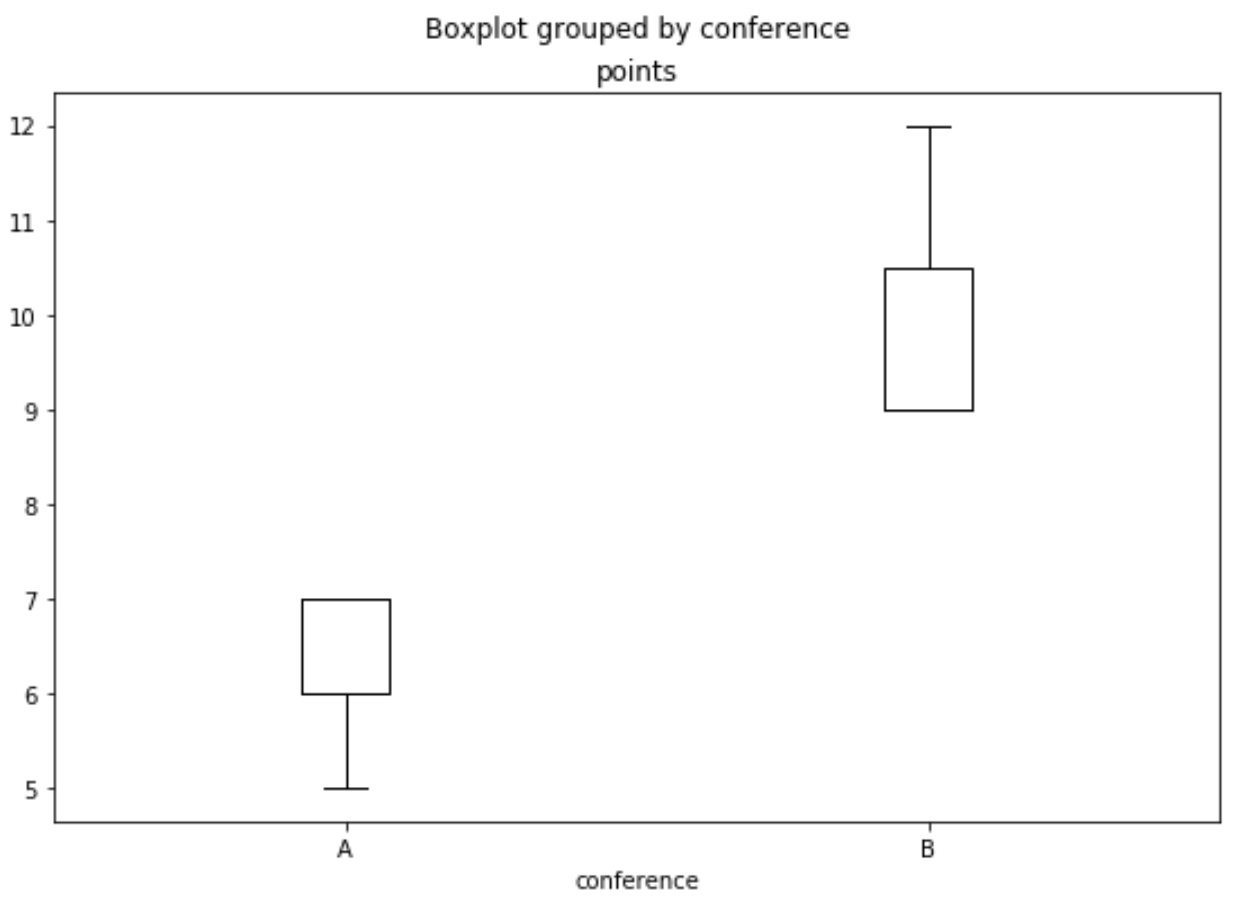
Esempio 3: boxplot raggruppato per una colonna
Il codice seguente mostra come creare un boxplot raggruppato per una colonna in un DataFrame panda:
df. boxplot (column=[' points '], by=' conference ', grid= False , color=' black ')
Risorse addizionali
Panda: come tracciare diverse serie
Panda: come tracciare più colonne su un grafico a barre
Informazioni sull'autore
Benjamin anderson
Ciao, sono Benjamin, un professore di statistica in pensione diventato insegnante dedicato di Statorials. Con una vasta esperienza e competenza nel campo della statistica, sono ansioso di condividere le mie conoscenze per potenziare gli studenti attraverso Statorials. Scopri di più