Come creare una curva a campana in python
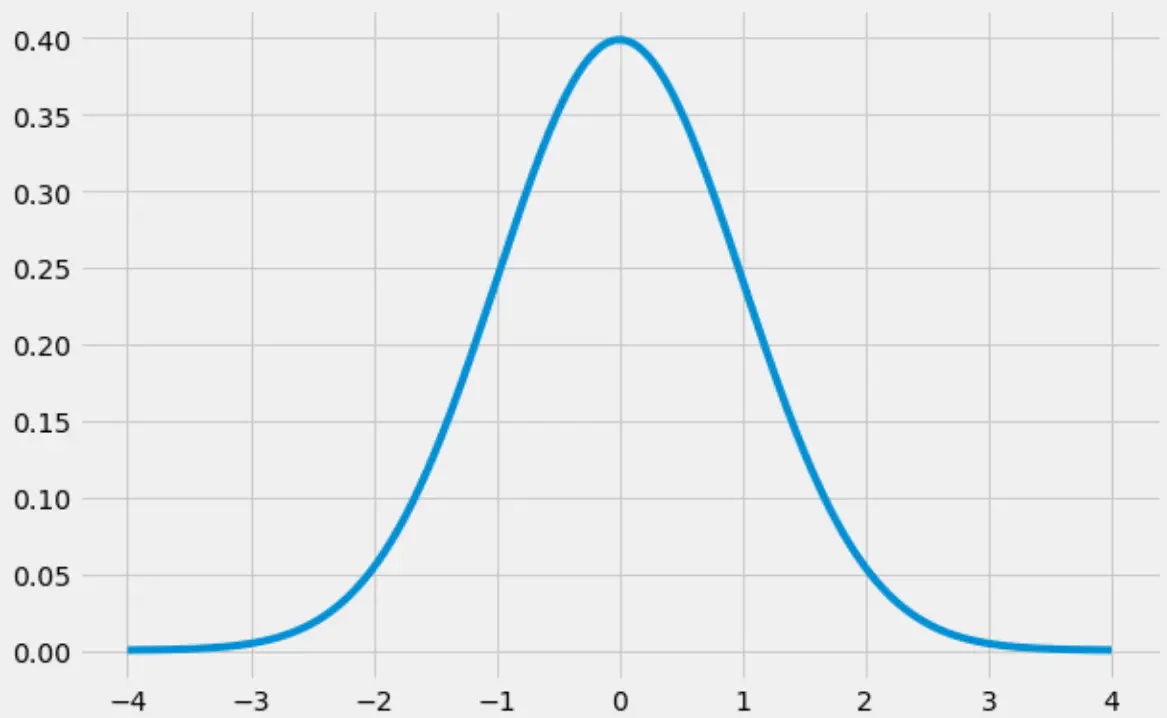
Una “curva a campana” è il soprannome dato alla forma di una distribuzione normale , che ha una distinta forma a “campana”:
Questo tutorial spiega come creare una curva a campana in Python.
Come creare una curva a campana in Python
Il codice seguente mostra come creare una curva a campana utilizzando le librerie numpy , scipy e matplotlib :
 import numpy as np
import matplotlib.pyplot as plt
from scipy.stats import norm

#create range of x-values from -4 to 4 in increments of .001
x = np.arange(-4, 4, 0.001)

#create range of y-values that correspond to normal pdf with mean=0 and sd=1
y = norm.pdf(x,0,1)

#defineplot
fig, ax = plt.subplots(figsize=(9,6))
ax.plot(x,y)

#choose plot style and display the bell curve
plt.style.use('fivethirtyeight')
plt.show()
Come riempire una curva a campana in Python
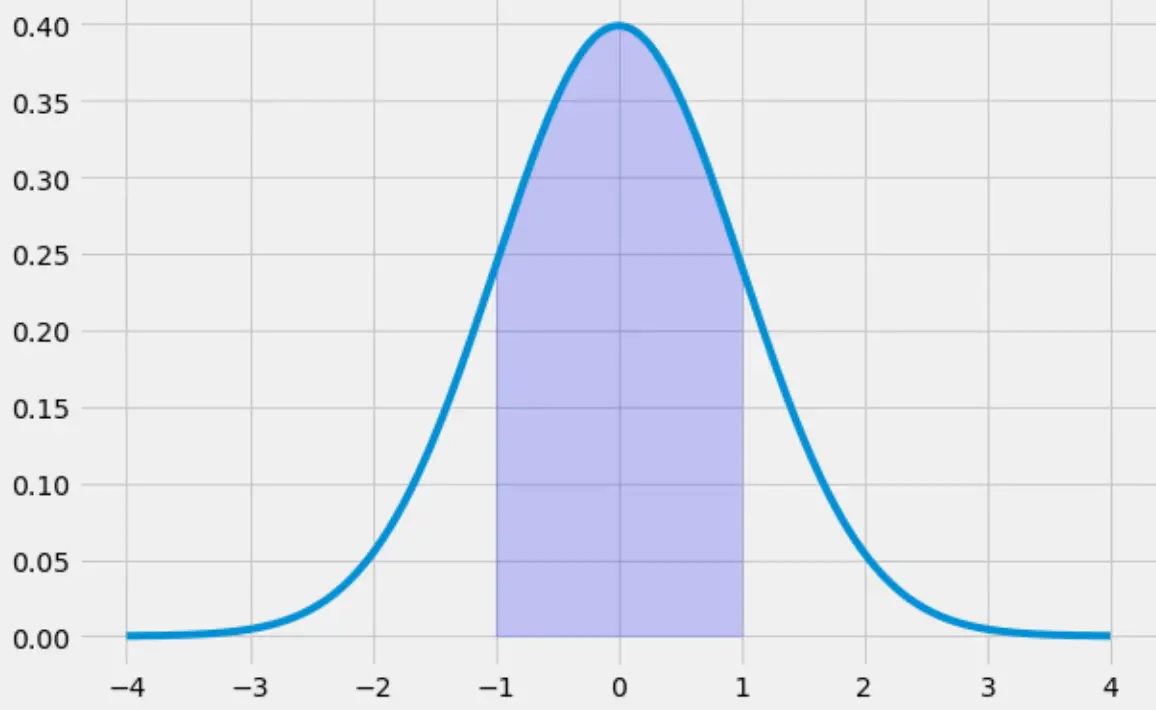
Il codice seguente illustra come riempire l’area sotto la curva a campana passando da -1 a 1:
 x = np.arange(-4, 4, 0.001)
y = norm.pdf(x,0,1)

fig, ax = plt.subplots(figsize=(9,6))
ax.plot(x,y)

#specify the region of the bell curve to fill in
x_fill = np.arange(-1, 1, 0.001)
y_fill = norm.pdf(x_fill,0,1)
ax.fill_between(x_fill,y_fill,0, alpha=0.2, color='blue')

plt.style.use('fivethirtyeight')
plt.show()
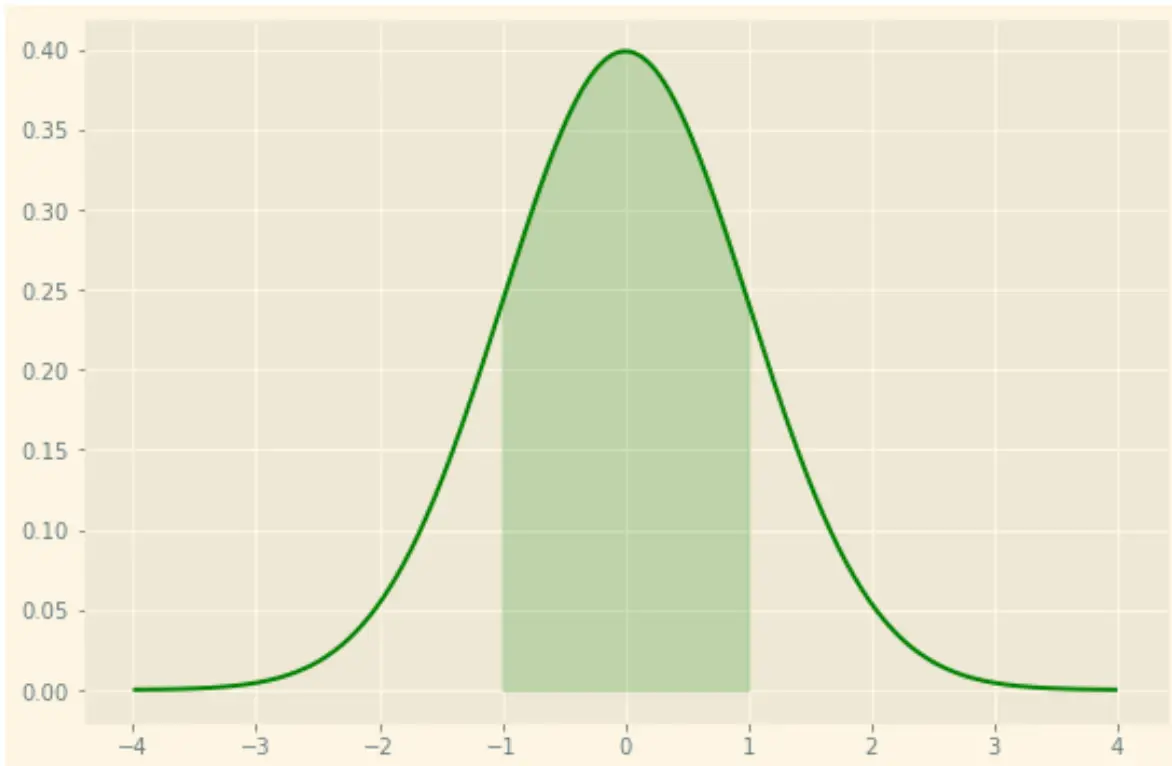
Tieni presente che puoi anche modellare la trama come preferisci utilizzando le numerose opzioni di stile di matplotlib . Ad esempio, puoi utilizzare un tema “luce solare” con una linea verde e un’ombreggiatura verde:
 x = np.arange(-4, 4, 0.001)
y = norm.pdf(x,0,1)

fig, ax = plt.subplots(figsize=(9,6))
ax.plot(x,y, color=' green ')

#specify the region of the bell curve to fill in
x_fill = np.arange(-1, 1, 0.001)
y_fill = norm.pdf(x_fill,0,1)
ax.fill_between(x_fill,y_fill,0, alpha=0.2, color=' green ')

plt.style.use(' Solarize_Light2 ')
plt.show()
Puoi trovare la guida di riferimento completa dei fogli di stile per matplotlib qui .
Risorse addizionali
Informazioni sull'autore
Benjamin anderson
Ciao, sono Benjamin, un professore di statistica in pensione diventato insegnante dedicato di Statorials. Con una vasta esperienza e competenza nel campo della statistica, sono ansioso di condividere le mie conoscenze per potenziare gli studenti attraverso Statorials. Scopri di più