Come tracciare una retta di regressione lineare in ggplot2 (con esempi)
È possibile utilizzare la libreria di visualizzazione R ggplot2 per tracciare un modello di regressione lineare adattato utilizzando la seguente sintassi di base:
 ggplot(data,aes(x, y)) +
  geom_point() +
  geom_smooth(method=' lm ')
L’esempio seguente mostra come utilizzare questa sintassi nella pratica.
Esempio: tracciare una linea di regressione lineare in ggplot2
Supponiamo di adattare un semplice modello di regressione lineare al seguente set di dati:
 #create dataset
data <- data.frame(y=c(6, 7, 7, 9, 12, 13, 13, 15, 16, 19, 22, 23, 23, 25, 26),
                   x=c(1, 2, 2, 3, 4, 4, 5, 6, 6, 8, 9, 9, 11, 12, 12))

#fit linear regression model to dataset and view model summary
model <- lm(y~x, data=data)
summary(model)

Call:
lm(formula = y ~ x, data = data)

Residuals:
    Min 1Q Median 3Q Max
-1.4444 -0.8013 -0.2426 0.5978 2.2363

Coefficients:
            Estimate Std. Error t value Pr(>|t|)
(Intercept) 4.20041 0.56730 7.404 5.16e-06 ***
x 1.84036 0.07857 23.423 5.13e-12 ***
---
Significant. codes: 0 '***' 0.001 '**' 0.01 '*' 0.05 '.' 0.1 ' ' 1

Residual standard error: 1.091 on 13 degrees of freedom
Multiple R-squared: 0.9769, Adjusted R-squared: 0.9751
F-statistic: 548.7 on 1 and 13 DF, p-value: 5.13e-12
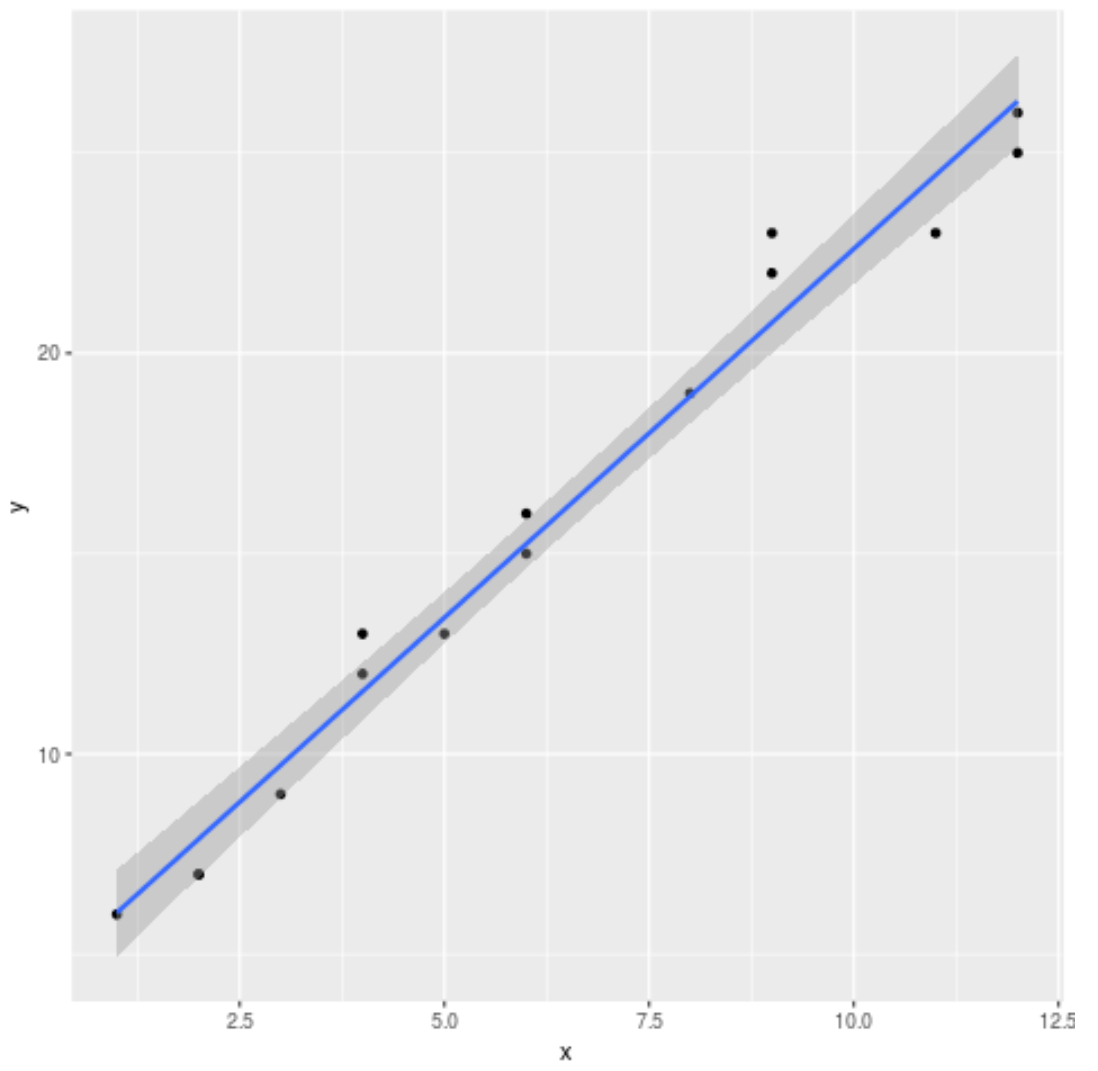
Il codice seguente mostra come visualizzare il modello di regressione lineare adattato:
 library (ggplot2)

#create plot to visualize fitted linear regression model
ggplot(data,aes(x, y)) +
  geom_point() +
  geom_smooth(method=' lm ')

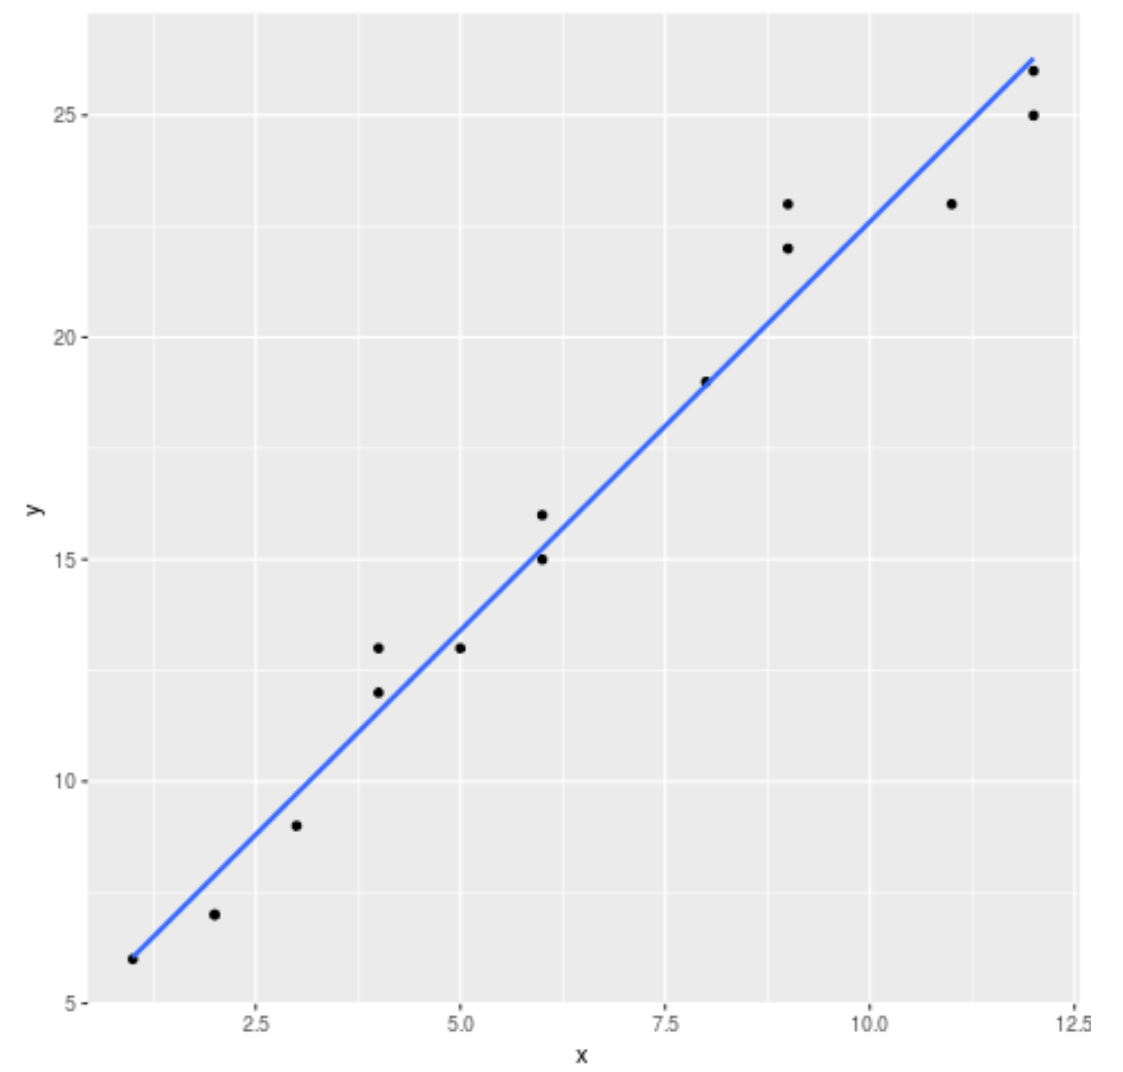
Per impostazione predefinita, ggplot2 aggiunge linee di errore standard al grafico. Puoi disabilitarli utilizzando l’argomento se=FALSE come segue:
 library (ggplot2)

#create regression plot with no standard error lines
ggplot(data,aes(x, y)) +
  geom_point() +
  geom_smooth(method=' lm ', se= FALSE )

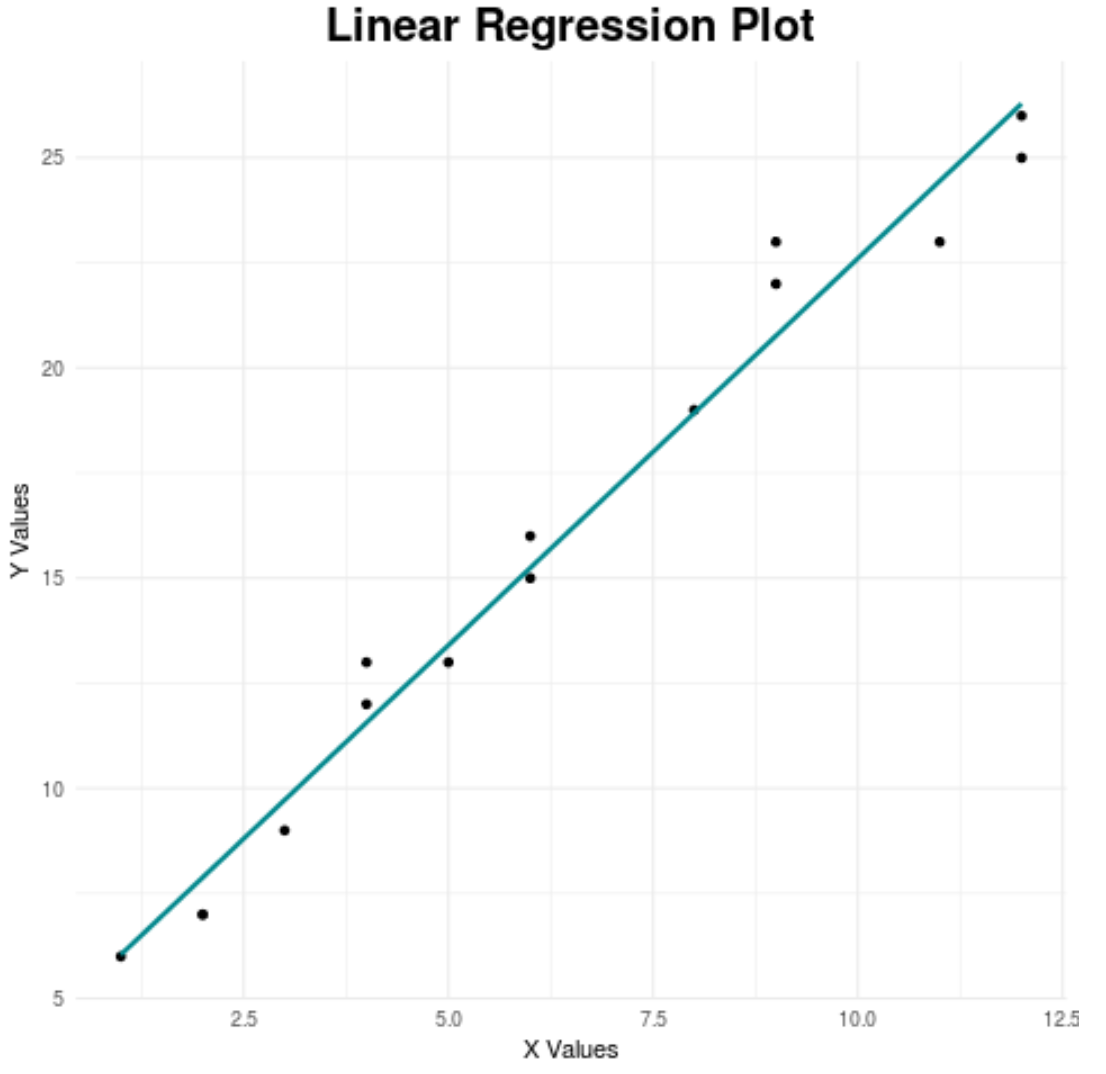
Infine, possiamo personalizzare alcuni aspetti del grafico per renderlo visivamente più accattivante:
 library (ggplot2)

#create regression plot with customized style
ggplot(data,aes(x, y)) +
  geom_point() +
  geom_smooth(method=' lm ', se= FALSE , color=' turquoise4 ') +
  theme_minimal() +
  labs(x=' X Values ', y=' Y Values ', title=' Linear Regression Plot ') +
  theme(plot.title = element_text(hjust=0.5, size=20, face=' bold '))

Fare riferimento a questo articolo per una guida completa ai migliori temi ggplot2.
Risorse addizionali
Un’introduzione alla regressione lineare multipla in R
Come tracciare un intervallo di confidenza in R