Come riempire le aree tra le righe in matplotlib
Puoi facilmente riempire l’area tra i valori in un grafico Matplotlib utilizzando le seguenti funzioni:
- fill_between() : riempie l’area tra due curve orizzontali.
- fill_betweenx() : riempie l’area tra due curve verticali.
Questo tutorial fornisce esempi di come utilizzare ciascuna di queste funzioni nella pratica.
Esempio 1: riempire l’area tra due linee orizzontali
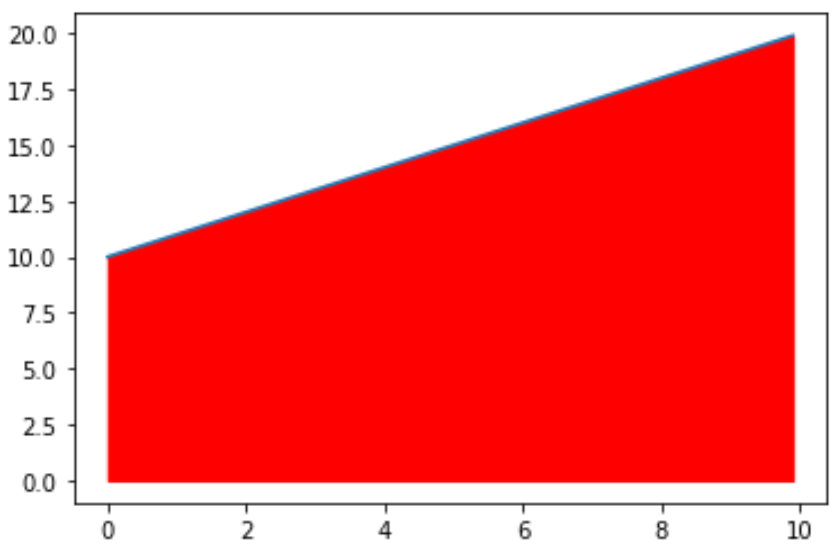
Il codice seguente mostra come riempire l’area tra due linee orizzontali:
 import matplotlib. pyplot as plt
import numpy as np

#define x and y values
x = np. arange (0,10,0.1)
y = np. arange (10,20,0.1)

#create plot of values
plt. plot (x,y)

#fill in area between the two lines
plt. fill_between (x,y,color=' red ')
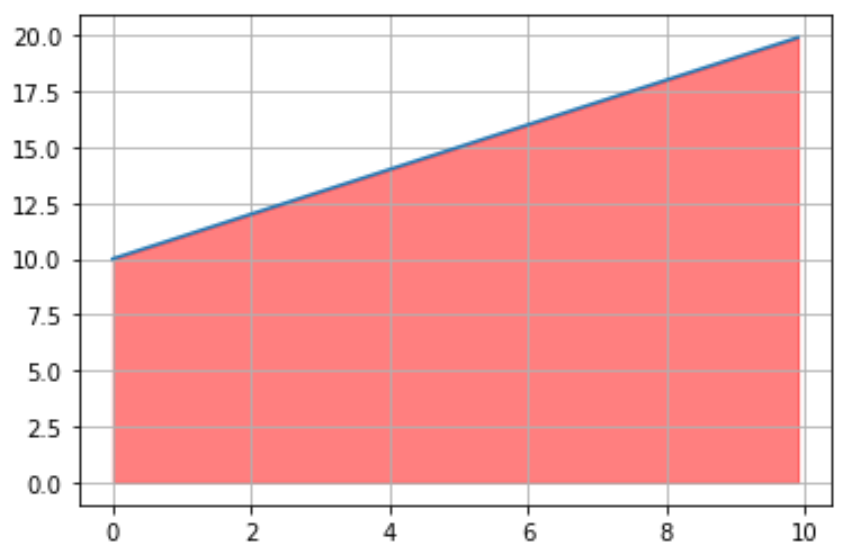
Tieni presente che possiamo anche utilizzare la funzione plt.grid() per aggiungere una griglia al grafico per vedere più facilmente quali valori sono riempiti:
 import matplotlib. pyplot as plt
import numpy as np

#define x and y values
x = np. arange (0,10,0.1)
y = np. arange (10,20,0.1)

#create plot of values
plt. plot (x,y)

#fill in area between the two lines
plt. fill_between (x, y, color=' red ', alpha= .5 )

#add gridlines
plt. grid ()
Esempio 2: riempire l’area sotto una curva
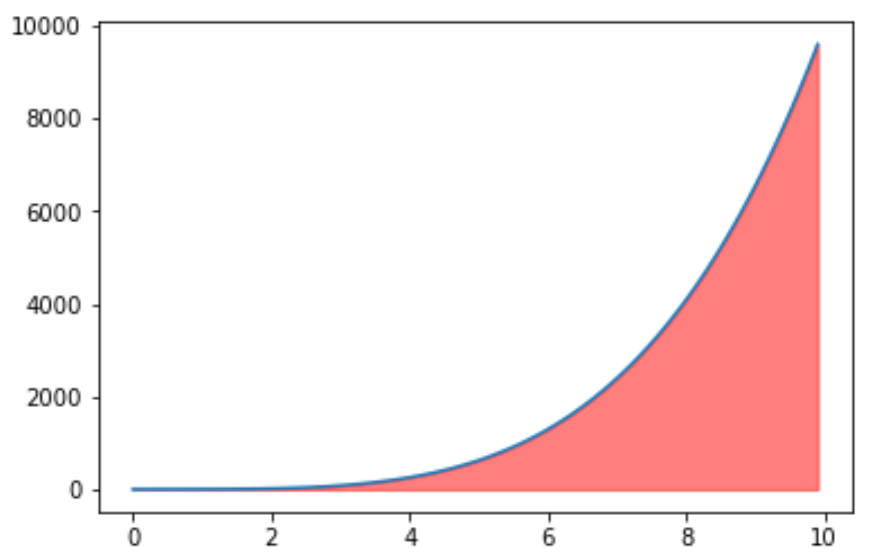
Il codice seguente mostra come riempire l’area sotto una curva:
 import matplotlib. pyplot as plt
import numpy as np

#define x and y values
x = np. arange (0,10,0.1)
y = x**4

#create plot of values
plt. plot (x,y)

#fill in area between the two lines
plt. fill_between (x, y, color=' red ', alpha= .5 )
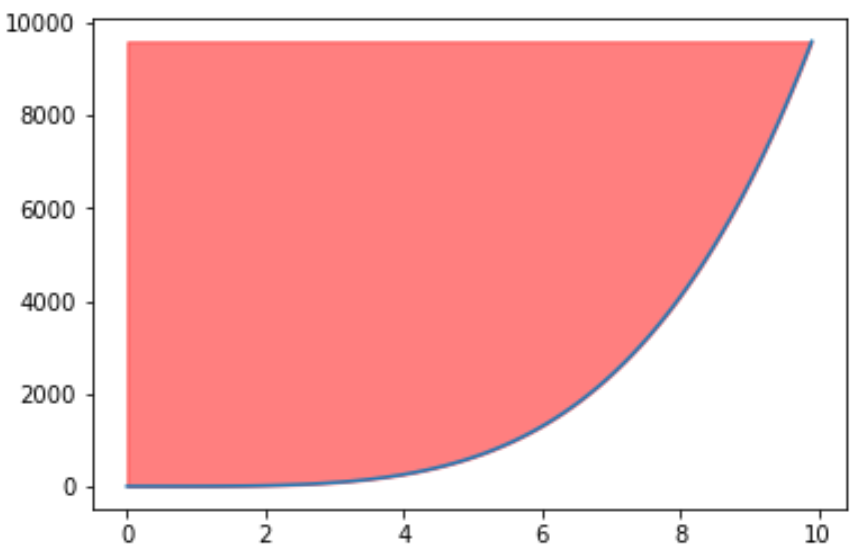
Esempio 3: riempire l’area sopra una curva
Il codice seguente mostra come riempire l’area sopra una curva:
 import matplotlib. pyplot as plt
import numpy as np

#define x and y values
x = np. arange (0,10,0.1)
y = x**4

#create plot of values
plt. plot (x,y)

#fill in area between the two lines
plt. fill_between (x, y, np. max (y), color=' red ', alpha= .5 )
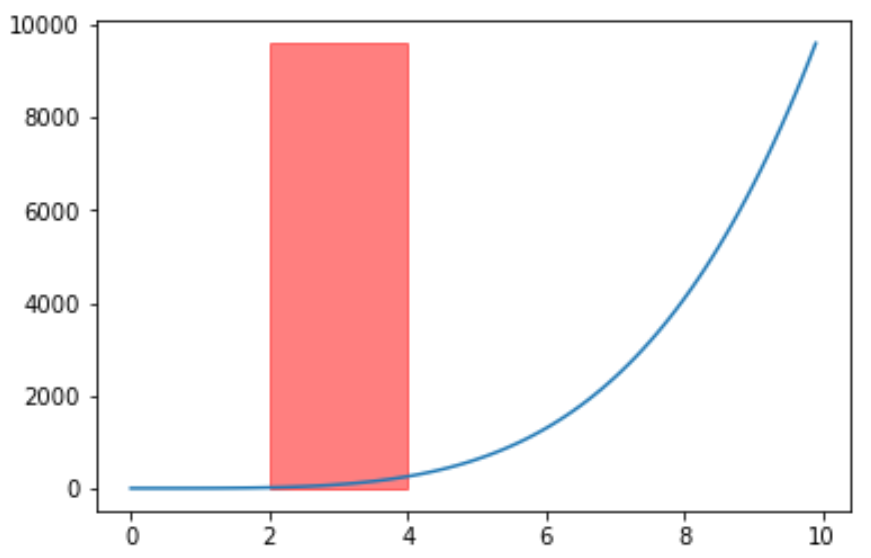
Esempio 4: riempire l’area tra due linee verticali
Il codice seguente mostra come utilizzare la funzione fill_betweenx() per riempire l’area tra due linee verticali:
 import matplotlib. pyplot as plt
import numpy as np

#define x and y values
x = np. arange (0,10,0.1)
y = np. arange (10,20,0.1)

#create plot of values
plt. plot (x,y)

#fill in area between the two lines
plt. fill_betweenx (y, 2, 4, color=' red ', alpha= .5 )
