Panda: come tracciare più dataframes in sottotrame
È possibile utilizzare la seguente sintassi di base per tracciare più dataframe panda in sottotrame:
 import matplotlib. pyplot as plt

#define subplot layout
fig, axes = plt. subplots (nrows= 2 , ncols= 2 )

#add DataFrames to subplots
df1. plot (ax=axes[0,0])
df2. plot (ax=axes[0,1])
df3. plot (ax=axes[1,0])
df4. plot (ax=axes[1,1])
L’esempio seguente mostra come utilizzare questa sintassi nella pratica.
Esempio: tracciare più dataframe Panda in sottotrame
Supponiamo di avere quattro DataFrames panda che contengono informazioni su vendite e resi in quattro diversi negozi al dettaglio:
 import pandas as pd

#create four DataFrames
df1 = pd. DataFrame ({' sales ': [2, 5, 5, 7, 9, 13, 15, 17, 22, 24],
                    ' returns ': [1, 2, 3, 4, 5, 6, 7, 8, 7, 5]})

df2 = pd. DataFrame ({' sales ': [2, 5, 11, 18, 15, 15, 14, 9, 6, 7],
                    ' returns ': [1, 2, 0, 2, 2, 4, 5, 4, 2, 1]})

df3 = pd. DataFrame ({' sales ': [6, 8, 8, 7, 8, 9, 10, 7, 8, 12],
                    ' returns ': [1,0, 1, 1, 1, 2, 3, 2, 1, 3]})

df4 = pd. DataFrame ({' sales ': [10, 7, 7, 6, 7, 6, 4, 3, 3, 2],
                    ' returns ': [4, 4, 3, 3, 2, 3, 2, 1, 1, 0]})
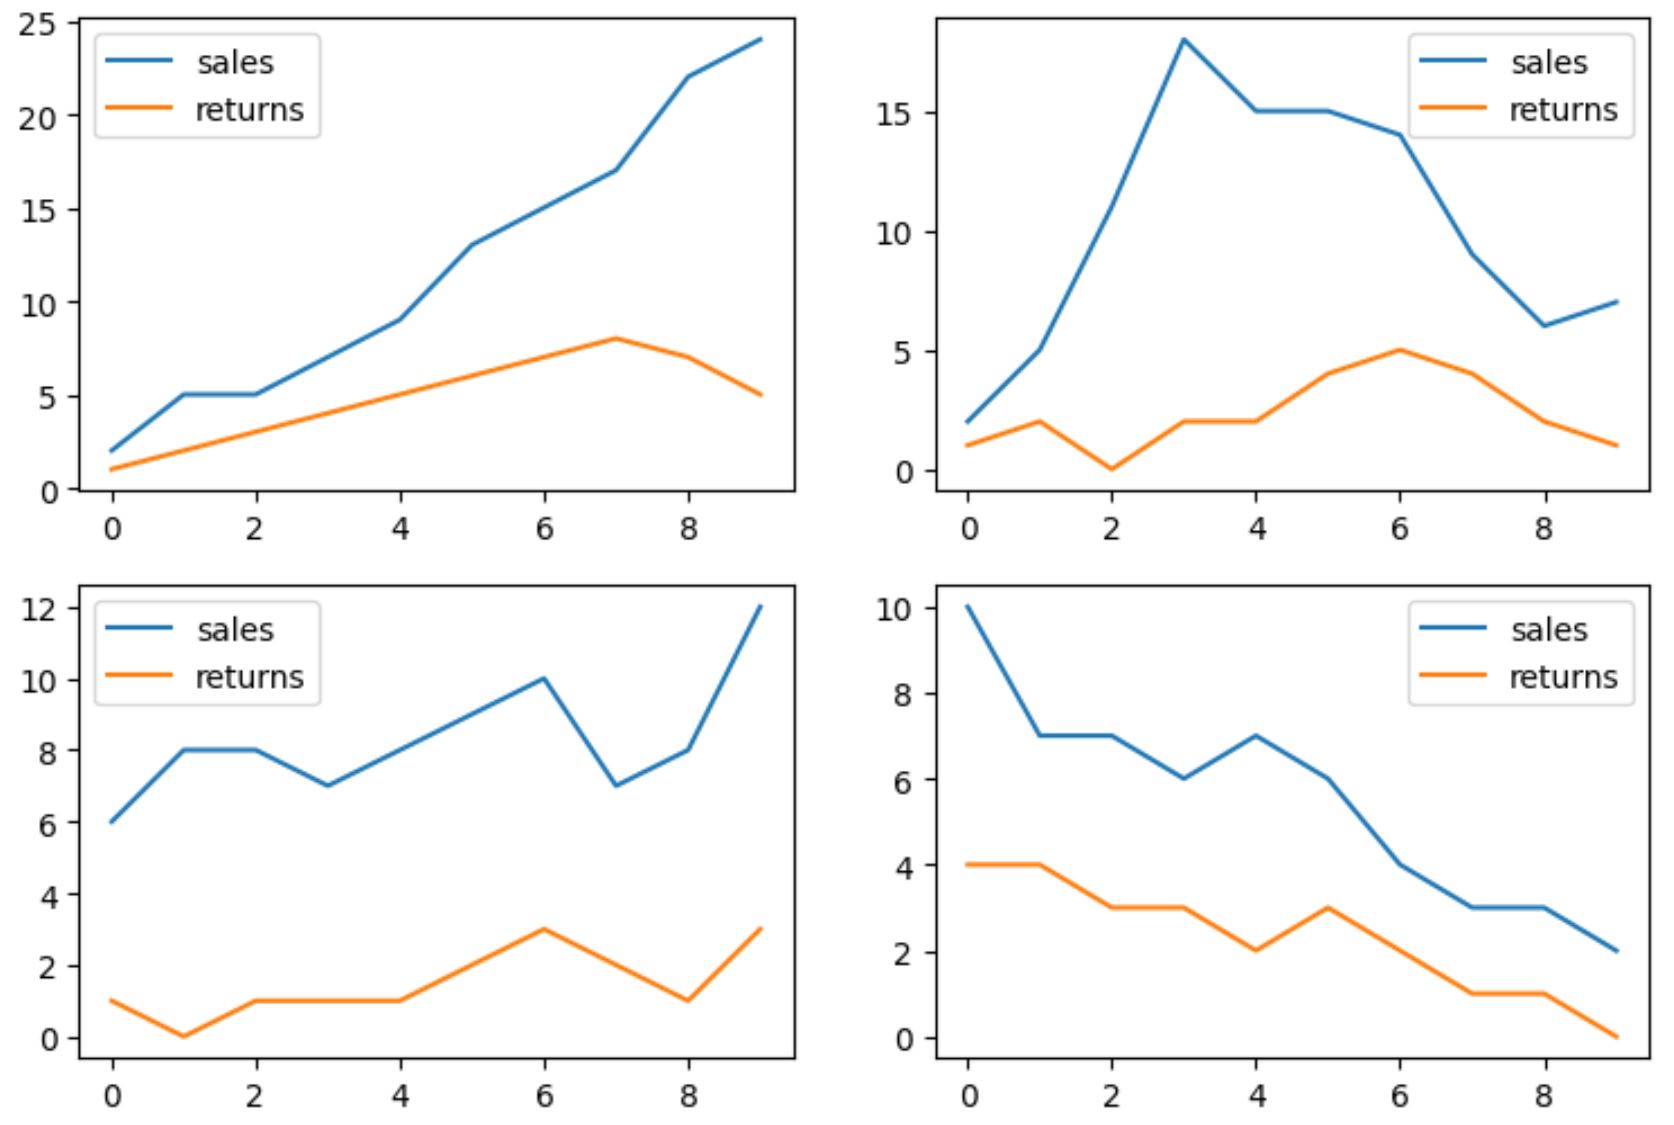
Possiamo utilizzare la seguente sintassi per tracciare ciascuno di questi DataFrames in una sottotrama avente un layout di 2 righe e 2 colonne:
 import matplotlib. pyplot as plt

#define subplot layout
fig, axes = plt. subplots (nrows= 2 , ncols= 2 )

#add DataFrames to subplots
df1. plot (ax=axes[0,0])
df2. plot (ax=axes[0,1])
df3. plot (ax=axes[1,0])
df4. plot (ax=axes[1,1])

Ciascuno dei quattro DataFrames viene visualizzato in una sottotrama.
Tieni presente che abbiamo utilizzato l’argomento assi per specificare dove posizionare ciascun DataFrame.
Ad esempio, il DataFrame chiamato df1 è stato posizionato nella posizione con un valore di indice di riga pari a 0 e un valore di indice di colonna pari a 0 (ad esempio la sottotrama nell’angolo in alto a sinistra).
Tieni inoltre presente che puoi modificare il layout delle sottotrame utilizzando gli argomenti nrows e ncols .
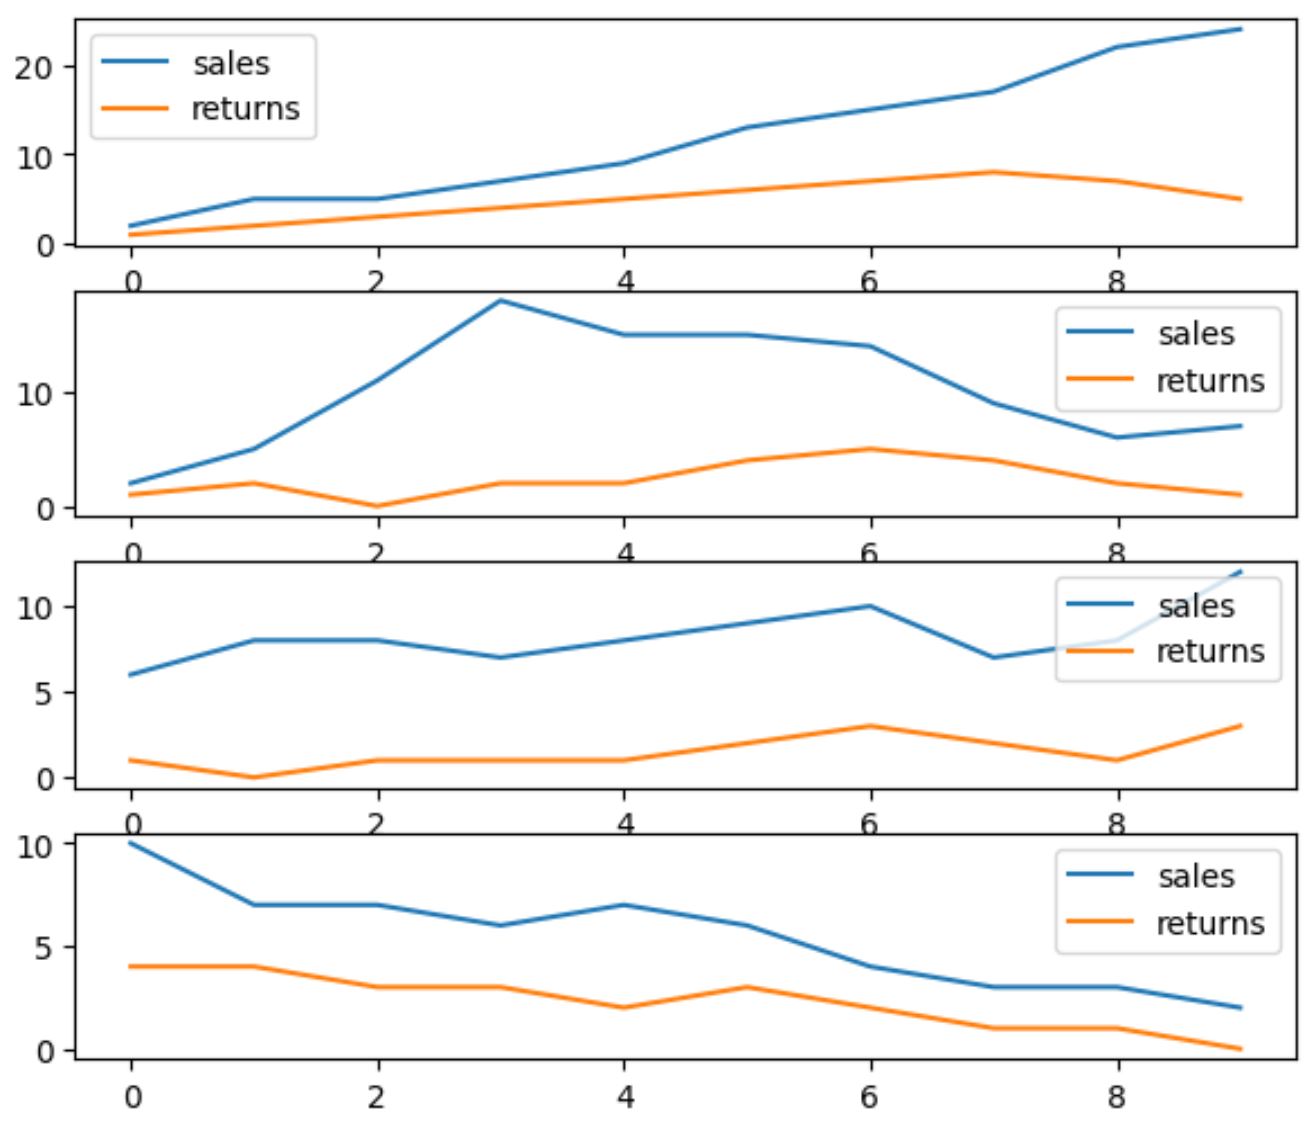
Ad esempio, il codice seguente mostra come organizzare le sottotrame in quattro righe e una colonna:
 import matplotlib. pyplot as plt

#define subplot layout
fig, axes = plt. subplots (nrows= 4 , ncols= 1 )

#add DataFrames to subplots
df1. plot (ax=axes[0])
df2. plot (ax=axes[1])
df3. plot (ax=axes[2])
df4. plot (ax=axes[3])

Le sottotrame sono ora disposte in un layout con quattro righe e una colonna.
Tieni presente che se desideri che le sottotrame abbiano le stesse scale sugli assi y e x, puoi utilizzare gli argomenti sharey e sharex .
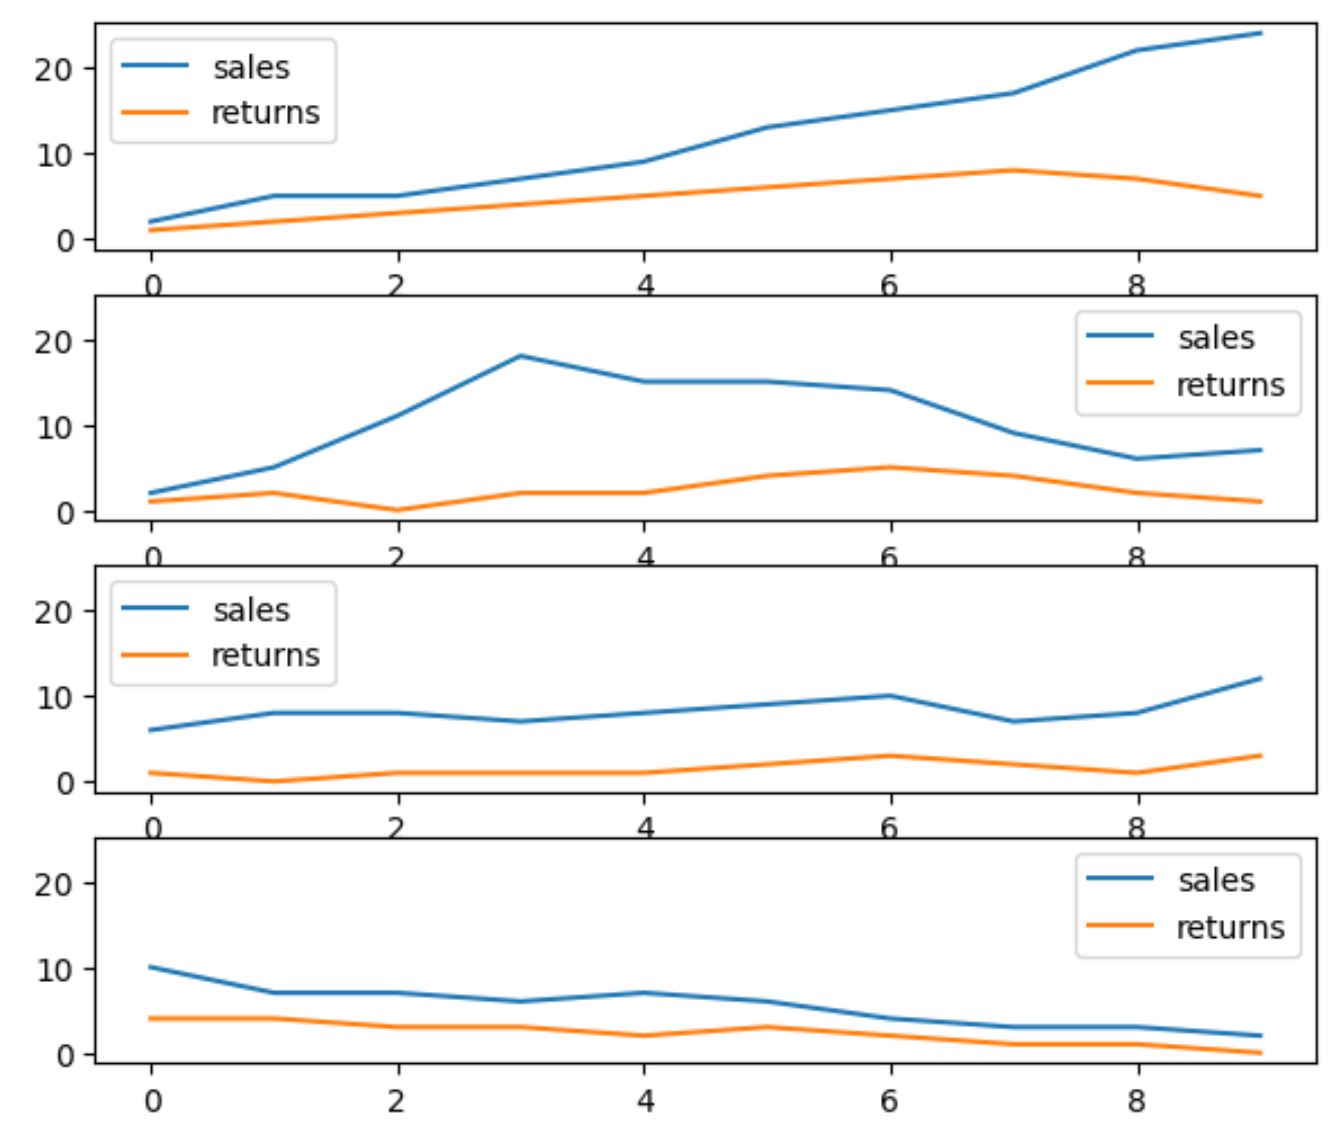
Ad esempio, il codice seguente mostra come utilizzare l’argomento sharey per forzare tutte le sottotrame ad avere la stessa scala sull’asse Y:
 import matplotlib. pyplot as plt

#define subplot layout, force subplots to have same y-axis scale
fig, axes = plt. subplots (nrows= 4 , ncols= 1 , sharey= True )

#add DataFrames to subplots
df1. plot (ax=axes[0])
df2. plot (ax=axes[1])
df3. plot (ax=axes[2])
df4. plot (ax=axes[3])

Tieni presente che l’asse Y di ciascuna sottotrama ora varia da 0 a 20.
Risorse addizionali
I seguenti tutorial spiegano come eseguire altre operazioni comuni nei panda:
Come creare un grafico a torta da Pandas DataFrame
Come creare una nuvola di punti da Pandas DataFrame
Come creare un istogramma da Pandas DataFrame