Come creare sottotrame in seaborn (con esempi)
È possibile utilizzare la seguente sintassi di base per creare sottotrame nella libreria di visualizzazione dati Seaborn in Python:
 #define dimensions of subplots (rows, columns)
fig, axes = plt. subplots (2, 2)

#create chart in each subplot
sns. boxplot (data=df, x=' team ', y=' points ', ax=axes[0,0])
sns. boxplot (data=df, x=' team ', y=' assists ', ax=axes[0,1])

...
L’esempio seguente mostra come utilizzare questa sintassi nella pratica.
Esempio: creazione di sottotrame in Seaborn
Supponiamo di avere i seguenti panda DataFrame:
 import pandas as pd

#createDataFrame
df = pd. DataFrame ({' team ': ['A', 'A', 'A', 'A', 'B', 'B', 'B', 'B'],
                   ' points ': [19, 12, 15, 14, 19, 23, 25, 29],
                   ' assists ': [13, 15, 11, 8, 6, 8, 11, 14],
                   ' rebounds ': [11, 7, 8, 12, 13, 7, 6, 8],
                   ' blocks ': [1, 2, 2, 3, 5, 4, 3, 3]})

#view DataFrame
print (df)

  team points assists rebounds blocks
0 A 19 13 11 1
1 A 12 15 7 2
2 A 15 11 8 2
3 A 14 8 12 3
4 B 19 6 13 5
5 B 23 8 7 4
6 B 25 11 6 3
7 B 29 14 8 3
Il codice seguente mostra come definire un’area del grafico con due righe e due colonne e creare un boxplot in ogni sottotrama per ciascuna delle quattro variabili numeriche nel DataFrame:
 import matplotlib. pyplot as plt
import seaborn as sns

#set seaborn plotting aesthetics as default
sns. set ()

#define plotting region (2 rows, 2 columns)
fig, axes = plt. subplots (2, 2)

#create boxplot in each subplot
sns. boxplot (data=df, x=' team ', y=' points ', ax=axes[0,0])
sns. boxplot (data=df, x=' team ', y=' assists ', ax=axes[0,1])
sns. boxplot (data=df, x=' team ', y=' rebounds ', ax=axes[1,0])
sns. boxplot (data=df, x=' team ', y=' blocks ', ax=axes[1,1])
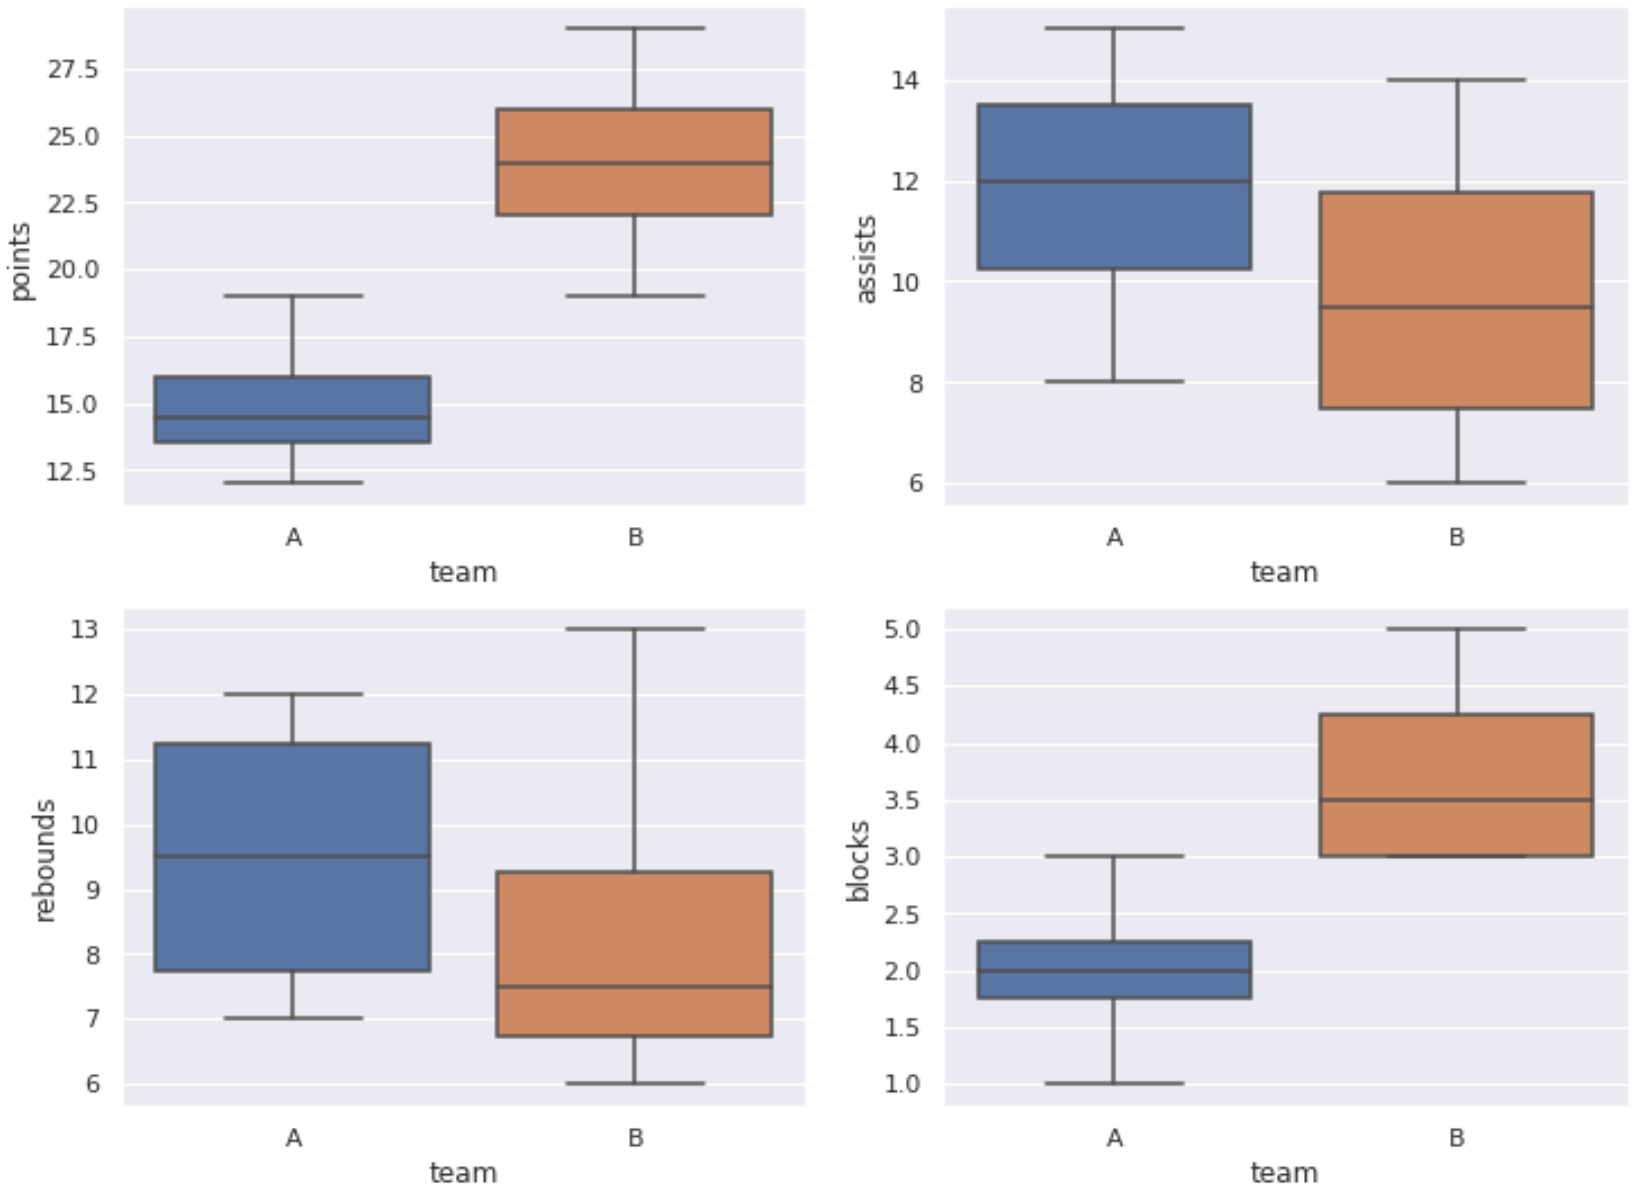
In questo esempio, abbiamo creato una regione del tracciato con due righe e due colonne e riempito ciascuna sottotrama con boxplot.
Tuttavia, possiamo utilizzare una sintassi simile per creare una regione del grafico con dimensioni diverse e popolare le sottotrame con grafici diversi.
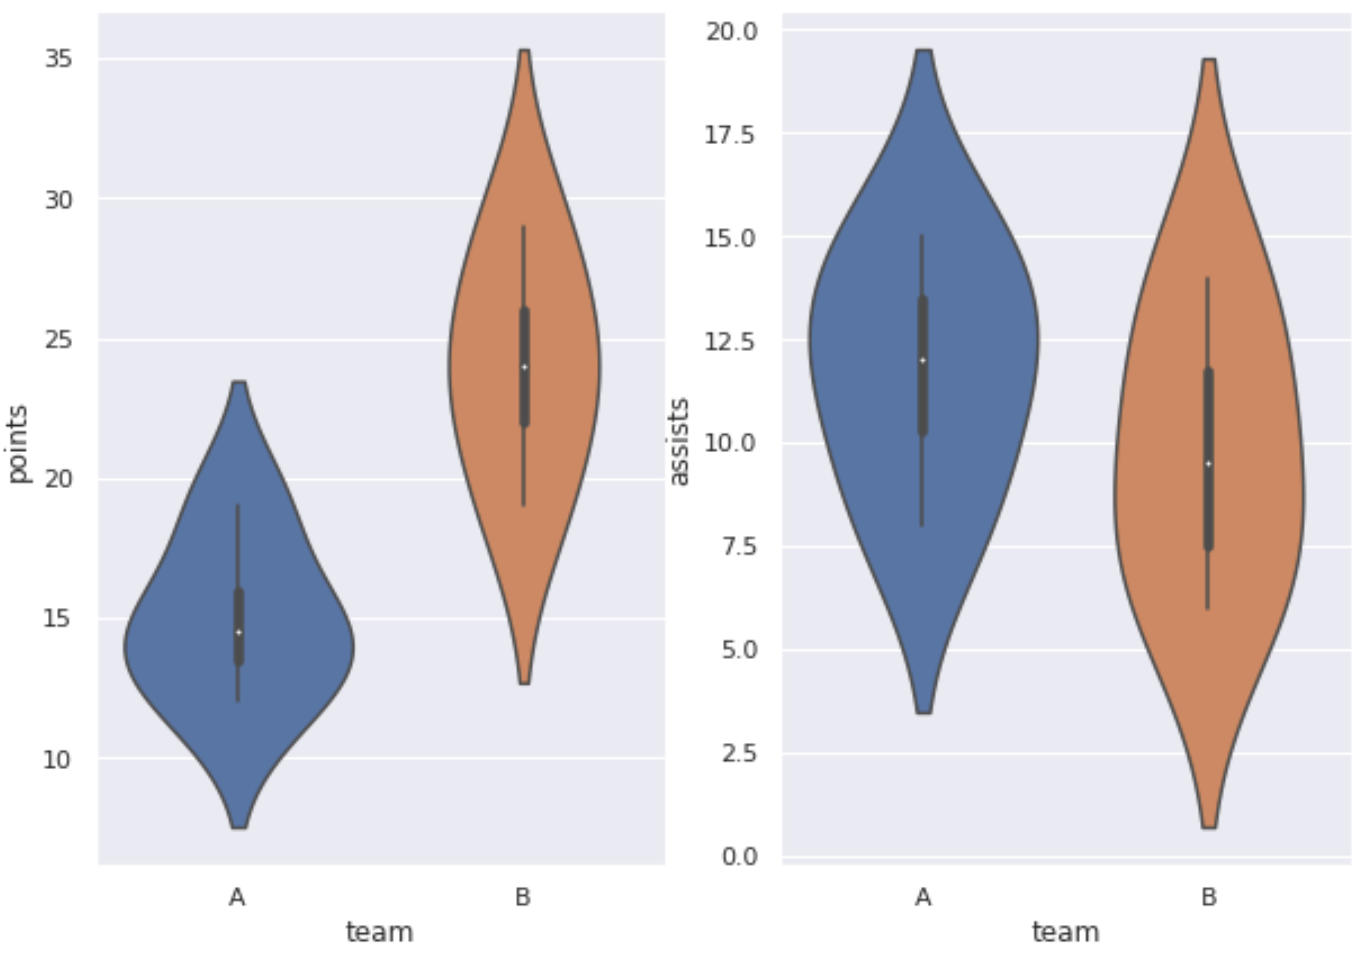
Ad esempio, il codice seguente mostra come creare un’area del grafico con una riga e due colonne e riempire ogni grafico con un grafico a violino:
 import matplotlib. pyplot as plt
import seaborn as sns

#set seaborn plotting aesthetics as default
sns. set ()

#define plotting region (1 row, 2 columns)
fig, axes = plt. subplots (1, 2)

#create boxplot in each subplot
sns. violinplot (data=df, x=' team ', y=' points ', ax=axes[0])
sns. violinplot (data=df, x=' team ', y=' assists ', ax=axes[1])
Risorse addizionali
I seguenti tutorial spiegano come eseguire altre funzioni comuni in Seaborn:
Come aggiungere un titolo alle trame di Seaborn
Come salvare la trama di Seaborn in un file
Come cambiare la posizione di una leggenda in Seaborn
Informazioni sull'autore
Benjamin anderson
Ciao, sono Benjamin, un professore di statistica in pensione diventato insegnante dedicato di Statorials. Con una vasta esperienza e competenza nel campo della statistica, sono ansioso di condividere le mie conoscenze per potenziare gli studenti attraverso Statorials. Scopri di più