Come sovrapporre una curva normale su un istogramma in r (2 esempi)
Spesso potresti voler sovrapporre una curva normale a un istogramma in R.
Gli esempi seguenti mostrano come eseguire questa operazione in base R e ggplot2 .
Esempio 1: sovrapporre una curva normale ad un istogramma di base R
Possiamo usare il seguente codice per creare un istogramma in base R e sovrapporre una curva normale all’istogramma:
 #make this example reproducible
set. seed ( 0 )

#define data
data <-rnorm( 1000 )

#create histogram
hist_data <- hist(data)

#define x and y values to use for normal curve
x_values <- seq(min(data), max(data), length = 100 )
y_values <- dnorm(x_values, mean = mean(data), sd = sd(data))
y_values <- y_values * diff(hist_data$mids[1:2]) * length(data)

#overlay normal curve on histogram
lines(x_values, y_values, lwd = 2 )
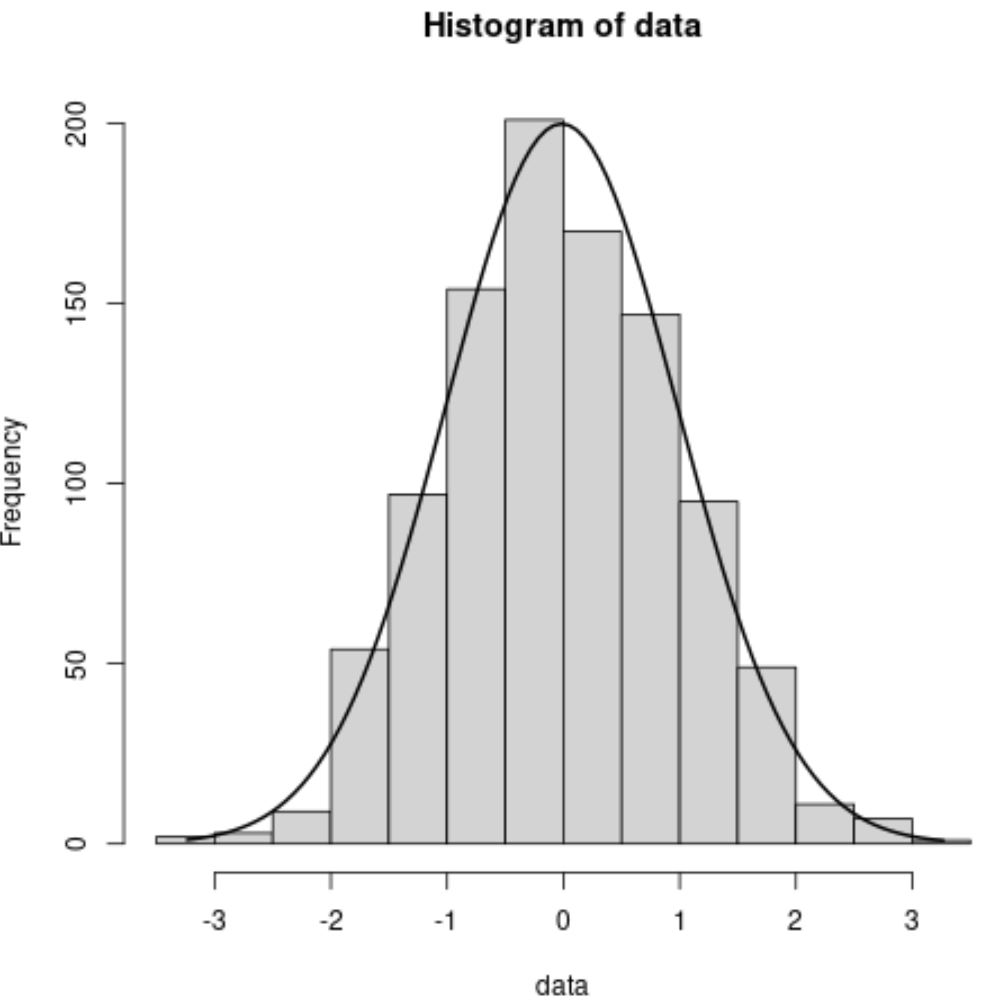
La curva nera nel grafico rappresenta la curva normale.
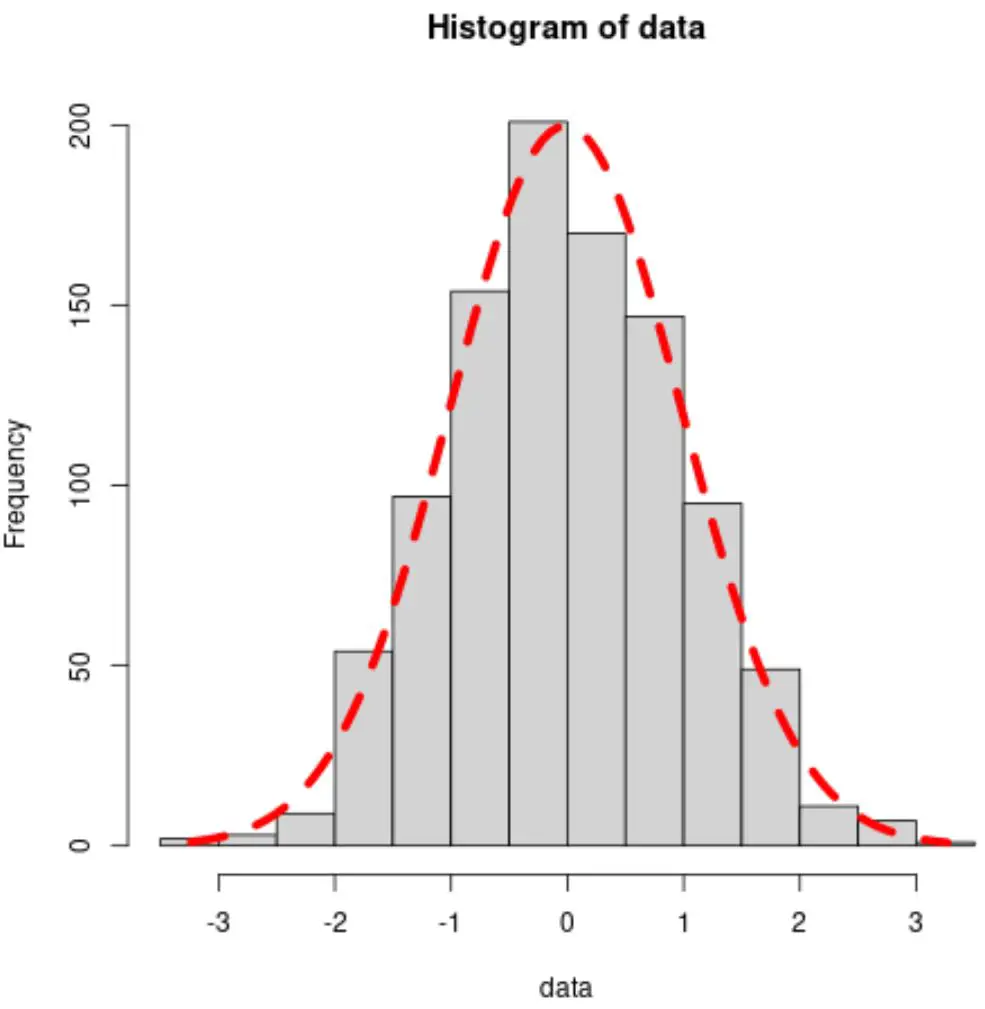
Sentiti libero di utilizzare gli argomenti col , lwd e lty per modificare rispettivamente il colore, la larghezza e il tipo di linea:
 #overlay normal curve with custom aesthetics
lines(x_values, y_values, col=' red ', lwd= 5 , lty=' dashed ')
Esempio 2: sovrapponi la curva normale all’istogramma in ggplot2
Possiamo usare il seguente codice per creare un istogramma in ggplot2 e sovrapporre una curva normale all’istogramma:
 library (ggplot2)

#make this example reproducible
set. seed ( 0 )

#define data
data <- data. frame (x=rnorm( 1000 ))

#create histogram and overlay normal curve
ggplot(data, aes(x)) +
  geom_histogram(aes(y = ..density..), fill=' lightgray ', col=' black ') +
  stat_function(fun = dnorm, args = list(mean=mean(data$x), sd=sd(data$x)))
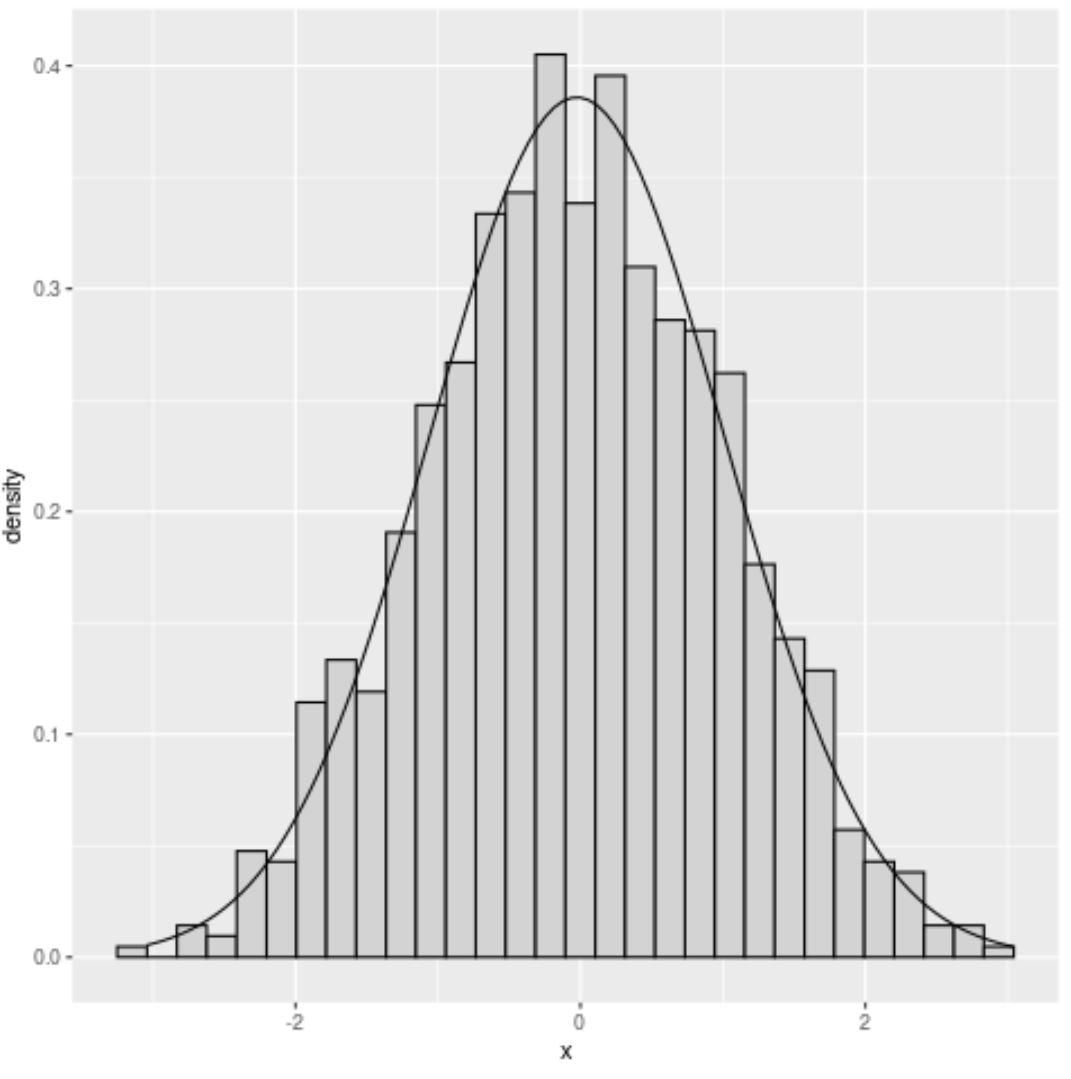
La curva nera nel grafico rappresenta la curva normale.
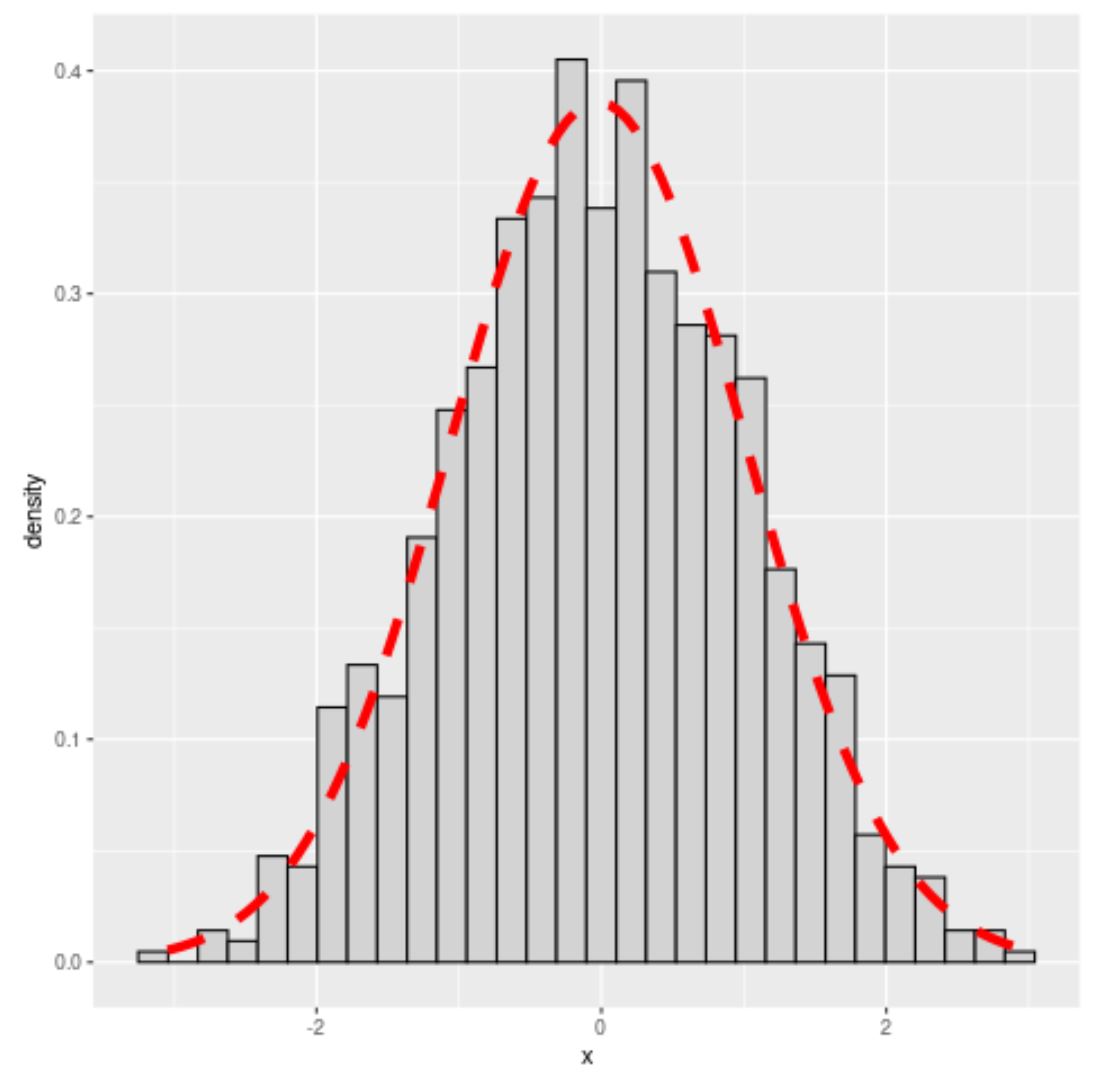
Sentiti libero di utilizzare gli argomenti col , lwd e lty per modificare rispettivamente il colore, la larghezza e il tipo di linea:
 #overlay normal curve with custom aesthetics
ggplot(data, aes(x)) +
  geom_histogram(aes(y = ..density..), fill=' lightgray ', col=' black ') +
  stat_function(fun = dnorm, args = list(mean=mean(data$x), sd=sd(data$x)),
                col=' red ', lwd= 2 , lty=' dashed '))
Nota : puoi trovare la documentazione completa per stat_functionqui .
Risorse addizionali
I seguenti tutorial spiegano come eseguire altre operazioni comuni in R:
Come creare un istogramma di frequenza relativo in R
Come specificare le interruzioni dell’istogramma in R
Informazioni sull'autore
Benjamin anderson
Ciao, sono Benjamin, un professore di statistica in pensione diventato insegnante dedicato di Statorials. Con una vasta esperienza e competenza nel campo della statistica, sono ansioso di condividere le mie conoscenze per potenziare gli studenti attraverso Statorials. Scopri di più