Come tracciare una distribuzione normale in python: con esempi
Per tracciare una distribuzione normale in Python, puoi utilizzare la seguente sintassi:
 #x-axis ranges from -3 and 3 with .001 steps
x = np. arange (-3, 3, 0.001)

#plot normal distribution with mean 0 and standard deviation 1
plt. plot (x, norm. pdf (x, 0, 1))
L’array x definisce l’intervallo dell’asse x e plt.plot() produce la curva della distribuzione normale con la media e la deviazione standard specificate.
I seguenti esempi mostrano come utilizzare queste funzioni nella pratica.
Esempio 1: tracciare una distribuzione normale singola
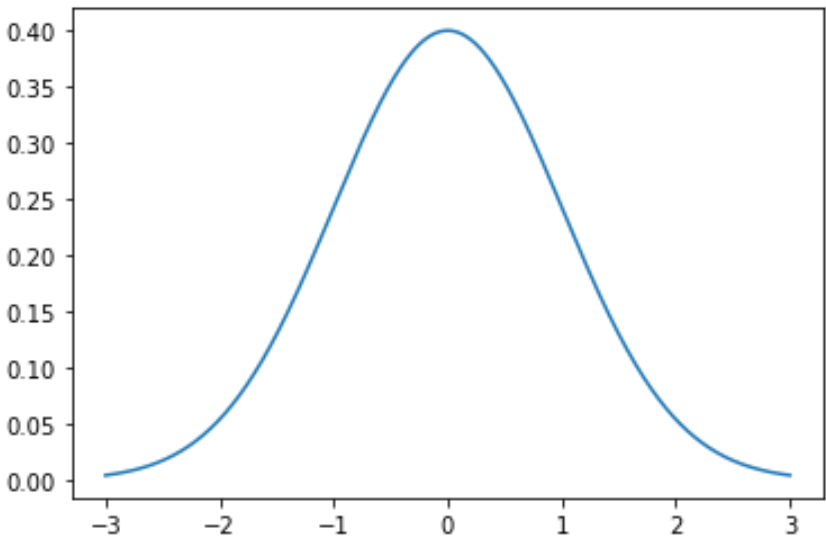
Il codice seguente mostra come tracciare una singola curva di distribuzione normale con una media pari a 0 e una deviazione standard pari a 1:
 import numpy as np
import matplotlib. pyplot as plt
from scipy. stats import norm

#x-axis ranges from -3 and 3 with .001 steps
x = np. arange (-3, 3, 0.001)

#plot normal distribution with mean 0 and standard deviation 1
plt. plot (x, norm. pdf (x, 0, 1))
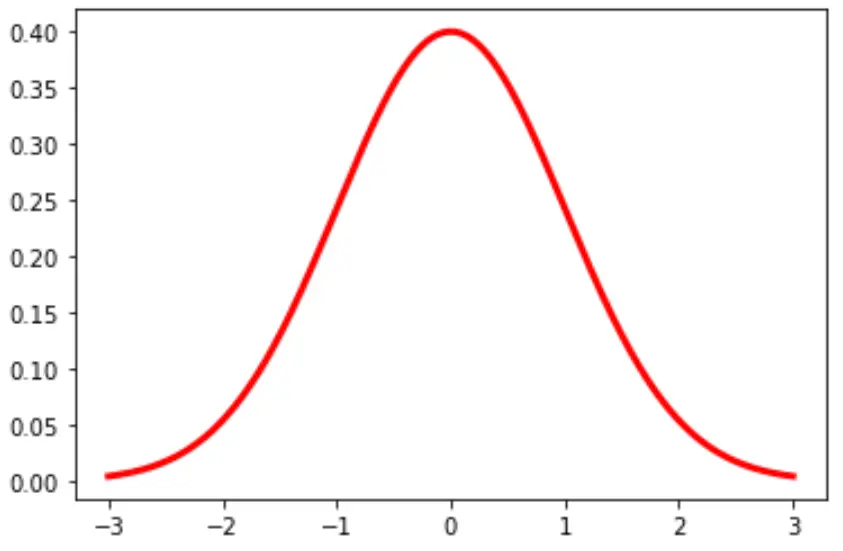
Puoi anche modificare il colore e la larghezza della linea nel grafico:
plt. plot (x, norm. pdf (x, 0, 1), color=' red ', linewidth= 3 )
Esempio 2: tracciare più distribuzioni normali
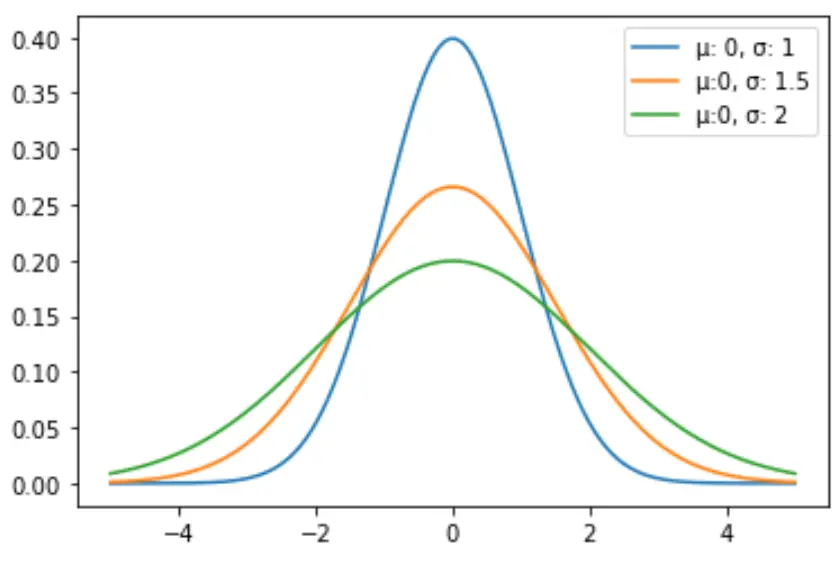
Il codice seguente mostra come tracciare più curve di distribuzione normale con medie e deviazioni standard diverse:
 import numpy as np
import matplotlib. pyplot as plt
from scipy. stats import norm

#x-axis ranges from -5 and 5 with .001 steps
x = np. arange (-5, 5, 0.001)

#define multiple normal distributions
plt. plot (x, norm. pdf (x, 0, 1), label=' μ: 0, σ: 1 ')
plt. plot (x, norm. pdf (x, 0, 1.5), label=' μ:0, σ: 1.5 ')
plt. plot (x, norm. pdf (x, 0, 2), label=' μ:0, σ: 2 ')

#add legend to plot
plt. legend ()
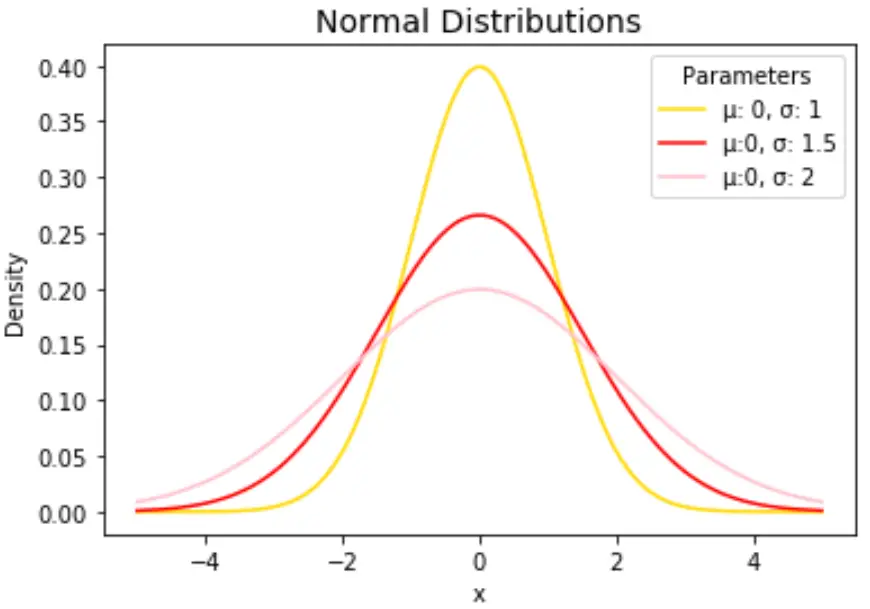
Sentiti libero di cambiare i colori delle linee e aggiungere un titolo e le etichette degli assi per completare il grafico:
 import numpy as np
import matplotlib. pyplot as plt
from scipy. stats import norm

#x-axis ranges from -5 and 5 with .001 steps
x = np. arange (-5, 5, 0.001)

#define multiple normal distributions
plt. plot (x, norm. pdf (x, 0, 1), label=' μ: 0, σ: 1 ', color=' gold ')
plt. plot (x, norm. pdf (x, 0, 1.5), label=' μ:0, σ: 1.5 ', color=' red ')
plt. plot (x, norm. pdf (x, 0, 2), label=' μ:0, σ: 2 ', color=' pink ')

#add legend to plot
plt. legend (title=' Parameters ')

#add axes labels and a title
plt. ylabel (' Density ')
plt. xlabel (' x ')
plt. title (' Normal Distributions ', fontsize= 14 )
Fare riferimento alla documentazione matplotlib per una spiegazione dettagliata della funzione plt.plot() .
Informazioni sull'autore
Benjamin anderson
Ciao, sono Benjamin, un professore di statistica in pensione diventato insegnante dedicato di Statorials. Con una vasta esperienza e competenza nel campo della statistica, sono ansioso di condividere le mie conoscenze per potenziare gli studenti attraverso Statorials. Scopri di più