Matplotlib でアスペクト比を設定する方法
matplotlib プロットのアスペクト比は、軸のスケーリングのアスペクト、つまり、x 単位に対する y 単位の比率を指します。
この比率は、 matplotlib.axes.Axes.set_aspect()関数を使用して変更できます。
set_aspect()関数は内部で実際にいわゆるデータ座標系を変更しますが、実際には通常、表示座標系を変更したいと考えます。
この変換を容易にするために、次のコードを使用できます。
 #define y-unit to x-unit ratio
ratio = 1.0

#get x and y limits
x_left, x_right = ax. get_xlim ()
y_low, y_high = ax. get_ylim ()

#set aspect ratio
ax. set_aspect ( abs ((x_right-x_left)/(y_low-y_high))*ratio)
この関数を実際に使用する例を見てみましょう。
ステップ 1: 基本的な Matplotlib プロットを作成する
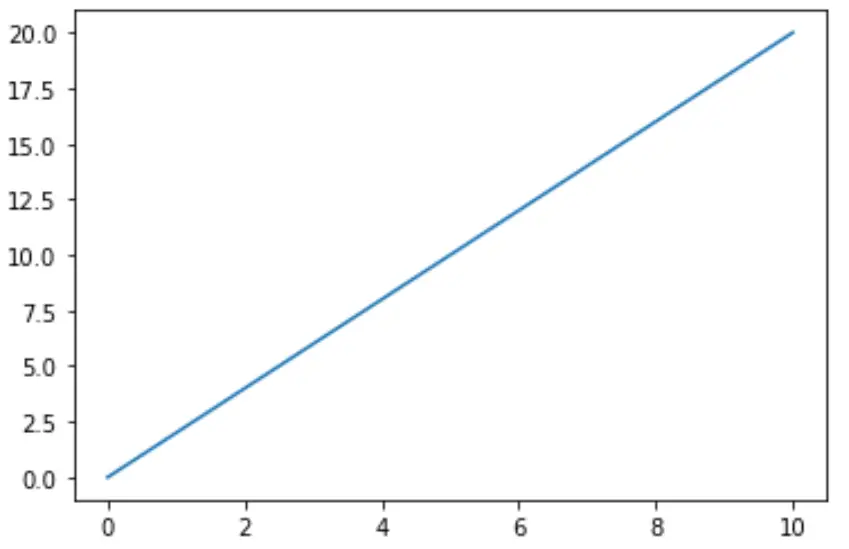
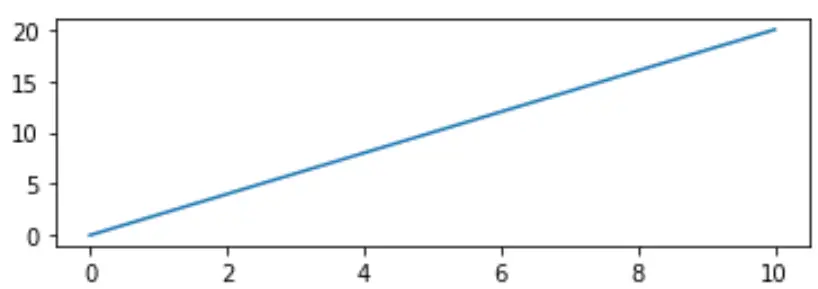
まず、Matplotlib を使用して単純な折れ線グラフを作成しましょう。
 import matplotlib.pyplot as plt

#define matplotlib figure and axis
fig, ax = plt. subplots ()

#create simple line plot
ax. plot ([0, 10],[0, 20])

#displayplot
plt. show ()
ステップ 2: アスペクト比を設定する (間違った方法)
x 軸が y 軸よりも長いことに注意してください。アスペクト比を 1 に設定してみましょう。つまり、x 軸と y 軸は等しくなければなりません。
 import matplotlib.pyplot as plt

#define matplotlib figure and axis
fig, ax = plt. subplots ()

#create simple line plot
ax. plot ([0, 10],[0, 20])

#attempt to set aspect ratio to 1
ax. set_aspect (1)

#displayplot
plt. show ()
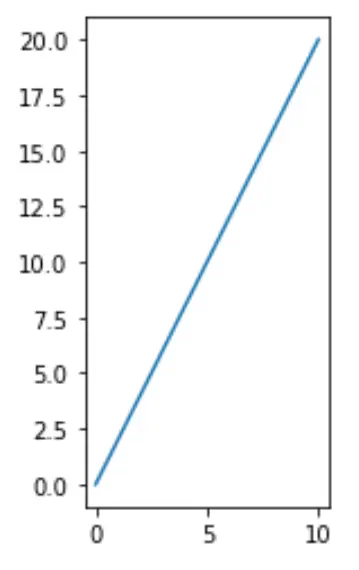
これは期待どおりに機能しなかったことに注意してください。 y 軸は x 軸よりもはるかに長いです。
ステップ 3: アスペクト比を設定する (正しい方法)
次のコードは、簡単な計算を使用して正しいアスペクト比を設定する方法を示しています。
 import matplotlib.pyplot as plt

#define matplotlib figure and axis
fig, ax = plt. subplots ()

#create simple line plot
ax. plot ([0, 10],[0, 20])

#set aspect ratio to 1
ratio = 1.0
x_left, x_right = ax. get_xlim ()
y_low, y_high = ax. get_ylim ()
ax. set_aspect ( abs ((x_right-x_left)/(y_low-y_high))*ratio)

#displayplot
plt. show ()
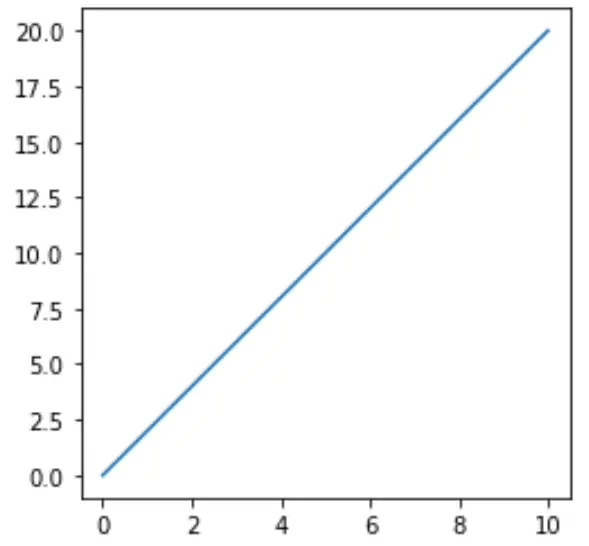
このプロットには予想通りのアスペクト比があることに注意してください。 x 軸と y 軸は同じ長さです。
ステップ 4: 好みに応じてアスペクト比を調整します
Y 軸を X 軸よりも長くしたい場合は、アスペクト比を 1 より大きい数値に指定するだけです。
 import matplotlib.pyplot as plt

#define matplotlib figure and axis
fig, ax = plt. subplots ()

#create simple line plot
ax. plot ([0, 10],[0, 20])

#set aspect ratio to 3
ratio = 3
x_left, x_right = ax. get_xlim ()
y_low, y_high = ax. get_ylim ()
ax. set_aspect ( abs ((x_right-x_left)/(y_low-y_high))*ratio)

#displayplot
plt. show ()
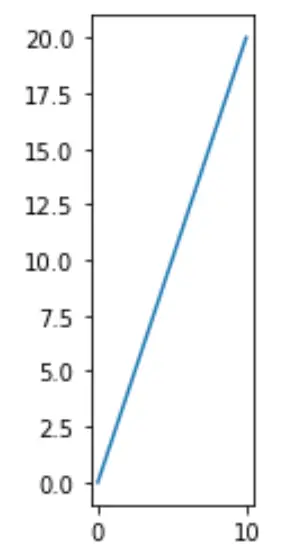
また、y 軸を x 軸より短くしたい場合は、アスペクト比を 1 未満の数値に指定するだけです。
 import matplotlib.pyplot as plt

#define matplotlib figure and axis
fig, ax = plt. subplots ()

#create simple line plot
ax. plot ([0, 10],[0, 20])

#set aspect ratio to .3
ratio = .3
x_left, x_right = ax. get_xlim ()
y_low, y_high = ax. get_ylim ()
ax. set_aspect ( abs ((x_right-x_left)/(y_low-y_high))*ratio)

#displayplot
plt. show ()
ここでその他の Matplotlib チュートリアルを見つけることができます。