Pandas: サブプロットで複数の dataframe をプロットする方法
次の基本構文を使用して、サブプロットに複数のパンダ データフレームをプロットできます。
 import matplotlib. pyplot as plt

#define subplot layout
fig, axes = plt. subplots (nrows= 2 , ncols= 2 )

#add DataFrames to subplots
df1. plot (ax=axes[0,0])
df2. plot (ax=axes[0,1])
df3. plot (ax=axes[1,0])
df4. plot (ax=axes[1,1])
次の例は、この構文を実際に使用する方法を示しています。
例: 複数の Pandas データフレームをサブプロットにプロットする
4 つの異なる小売店の販売と返品に関する情報を含む 4 つのパンダ DataFrame があるとします。
 import pandas as pd

#create four DataFrames
df1 = pd. DataFrame ({' sales ': [2, 5, 5, 7, 9, 13, 15, 17, 22, 24],
                    ' returns ': [1, 2, 3, 4, 5, 6, 7, 8, 7, 5]})

df2 = pd. DataFrame ({' sales ': [2, 5, 11, 18, 15, 15, 14, 9, 6, 7],
                    ' returns ': [1, 2, 0, 2, 2, 4, 5, 4, 2, 1]})

df3 = pd. DataFrame ({' sales ': [6, 8, 8, 7, 8, 9, 10, 7, 8, 12],
                    ' returns ': [1,0, 1, 1, 1, 2, 3, 2, 1, 3]})

df4 = pd. DataFrame ({' sales ': [10, 7, 7, 6, 7, 6, 4, 3, 3, 2],
                    ' returns ': [4, 4, 3, 3, 2, 3, 2, 1, 1, 0]})
次の構文を使用して、これらの各 DataFrame を 2 行 2 列のレイアウトを持つサブプロットにプロットできます。
 import matplotlib. pyplot as plt

#define subplot layout
fig, axes = plt. subplots (nrows= 2 , ncols= 2 )

#add DataFrames to subplots
df1. plot (ax=axes[0,0])
df2. plot (ax=axes[0,1])
df3. plot (ax=axes[1,0])
df4. plot (ax=axes[1,1])

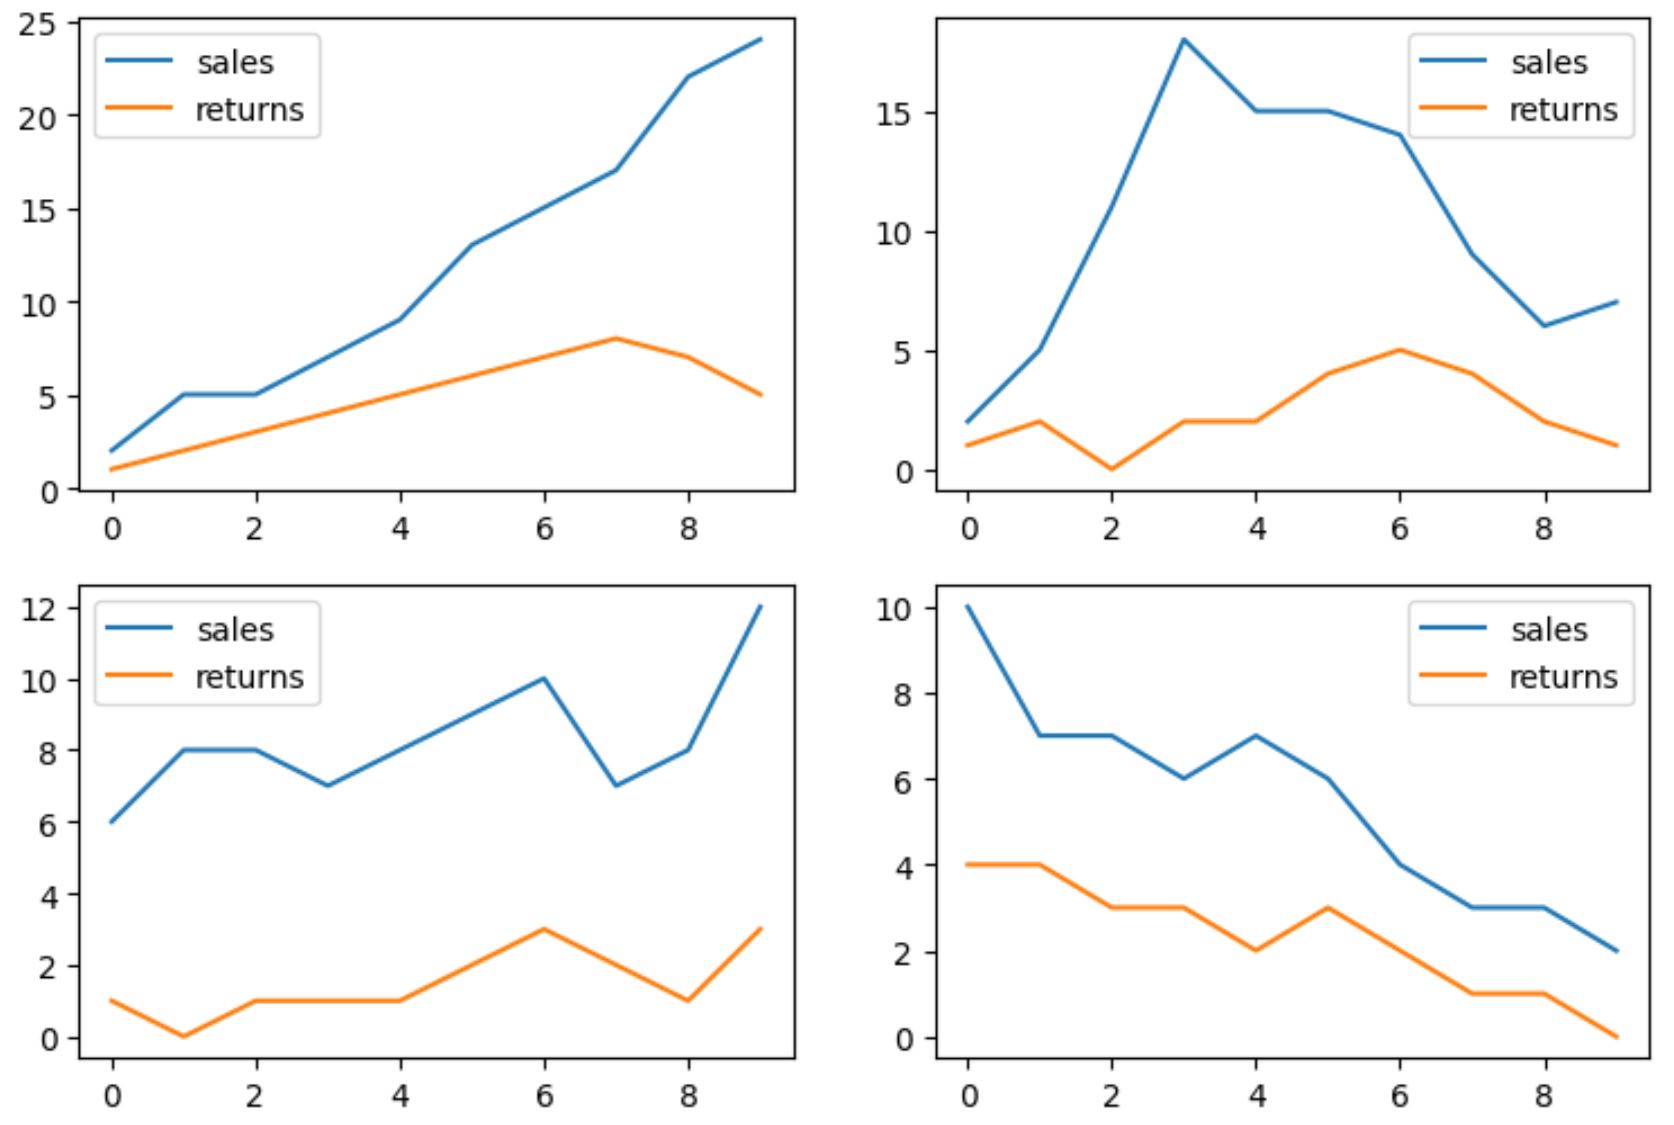
4 つの DataFrame はそれぞれサブプロットに表示されます。
各 DataFrame を配置する場所を指定するために、 axes引数を使用したことに注意してください。
たとえば、 df1という名前の DataFrame は、行インデックス値0 、列インデックス値0の位置 (たとえば、左上隅のサブプロット) に配置されました。
また、 nrows 引数とncols引数を使用してサブプロットのレイアウトを変更できることにも注意してください。
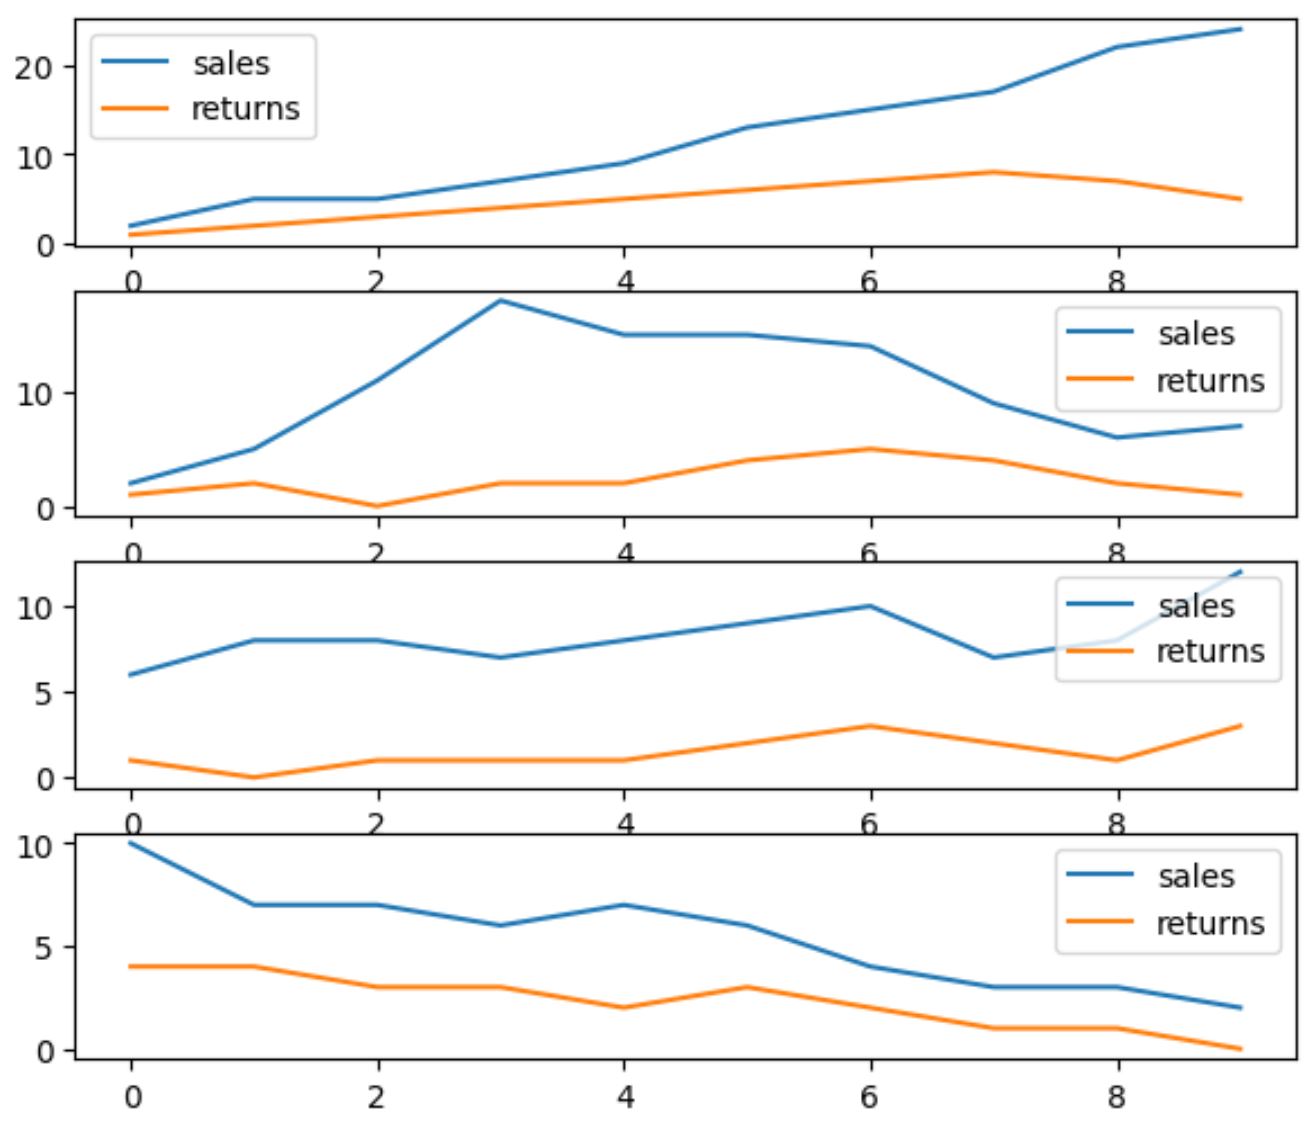
たとえば、次のコードは、サブプロットを 4 行 1 列に編成する方法を示しています。
 import matplotlib. pyplot as plt

#define subplot layout
fig, axes = plt. subplots (nrows= 4 , ncols= 1 )

#add DataFrames to subplots
df1. plot (ax=axes[0])
df2. plot (ax=axes[1])
df3. plot (ax=axes[2])
df4. plot (ax=axes[3])

サブプロットは 4 行 1 列のレイアウトに配置されます。
サブプロットの y 軸と x 軸のスケールを同じにしたい場合は、 shareyおよびsharex引数を使用できることに注意してください。
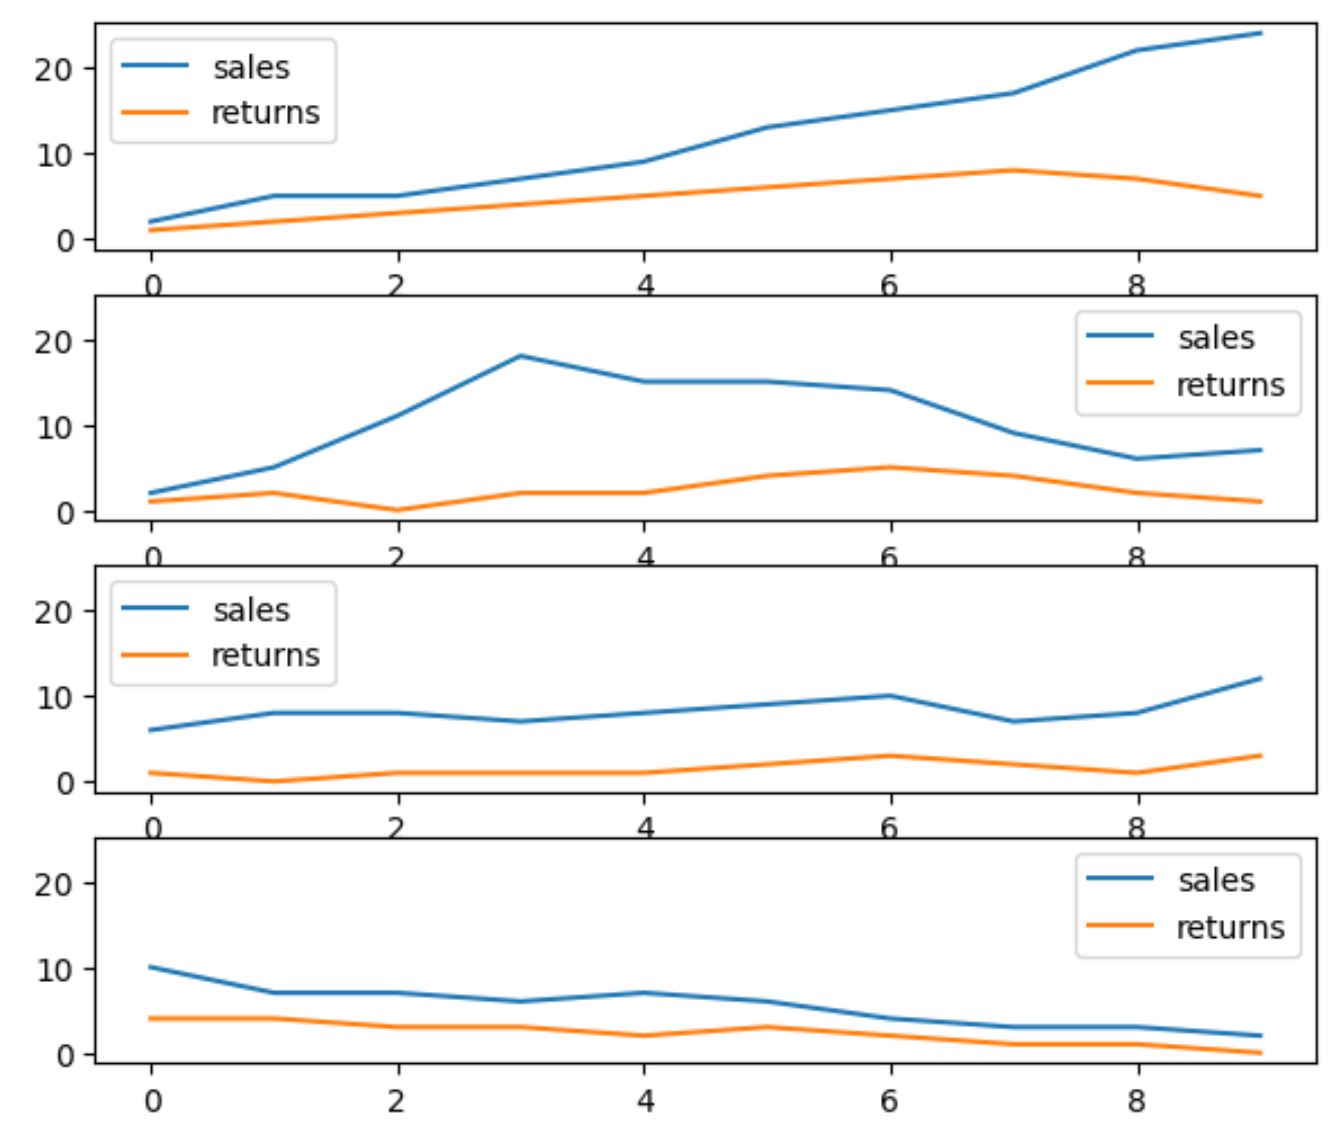
たとえば、次のコードは、 sharey引数を使用して、すべてのサブプロットの Y 軸のスケールを強制的に同じにする方法を示しています。
 import matplotlib. pyplot as plt

#define subplot layout, force subplots to have same y-axis scale
fig, axes = plt. subplots (nrows= 4 , ncols= 1 , sharey= True )

#add DataFrames to subplots
df1. plot (ax=axes[0])
df2. plot (ax=axes[1])
df3. plot (ax=axes[2])
df4. plot (ax=axes[3])

各サブプロットの Y 軸の範囲が 0 から 20 になることに注意してください。
追加リソース
次のチュートリアルでは、パンダで他の一般的な操作を実行する方法を説明します。
Pandas DataFrame から円グラフを作成する方法
Pandas DataFrame から点群を作成する方法
Pandas DataFrame からヒストグラムを作成する方法