R で回帰直線を含む散布図を作成する方法
単純な線形回帰を実行するとき、散布図を作成して、x 値と y 値のさまざまな組み合わせを視覚化したいことがよくあります。
幸いなことに、R では、 plot()関数を使用して点群を簡単に作成できます。例えば:
 #create some fake data
data <- data.frame(x = c(1, 1, 2, 3, 4, 4, 5, 6, 7, 7, 8, 9, 10, 11, 11),
                   y = c(13, 14, 17, 12, 23, 24, 25, 25, 24, 28, 32, 33, 35, 40, 41))

#create scatterplot of data
plot(data$x, data$y)
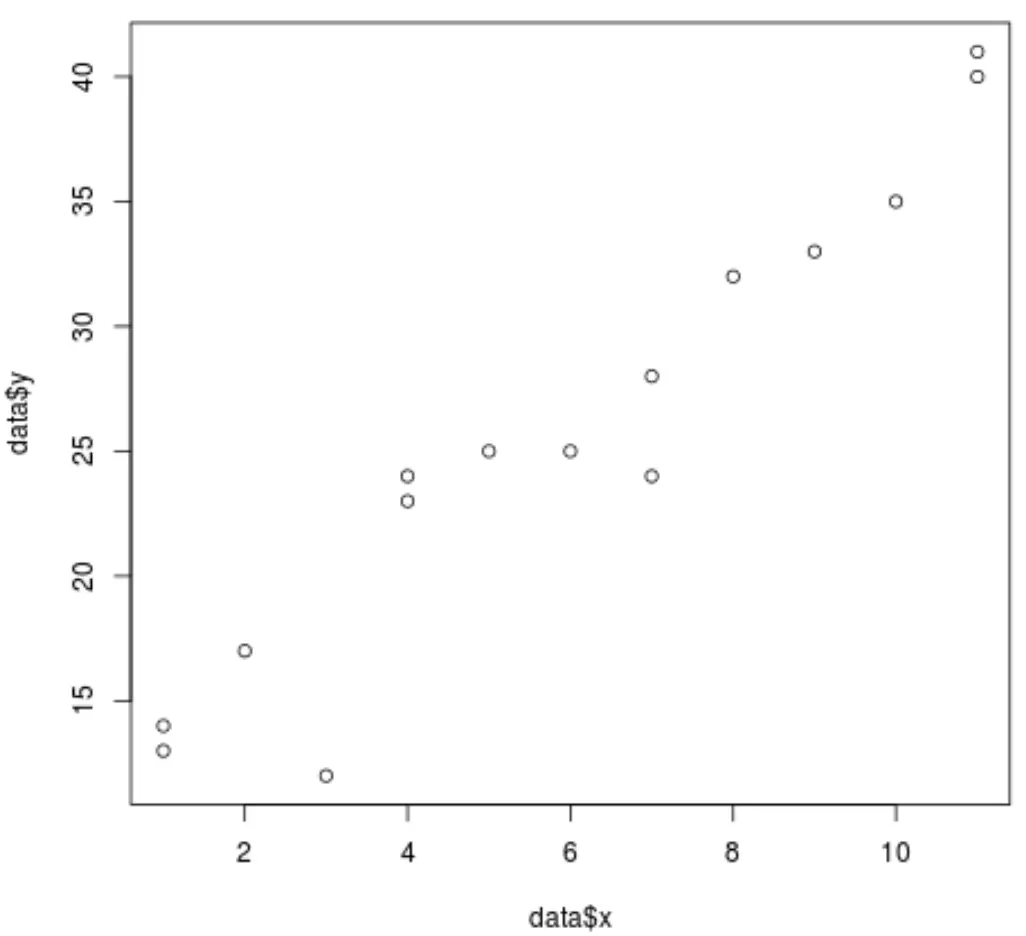
abline()関数を使用すると、散布図に回帰直線を簡単に追加することもできます。
例えば:
 #fit a simple linear regression model
model <- lm(y ~ x, data = data)

#add the fitted regression line to the scatterplot
abline(model)
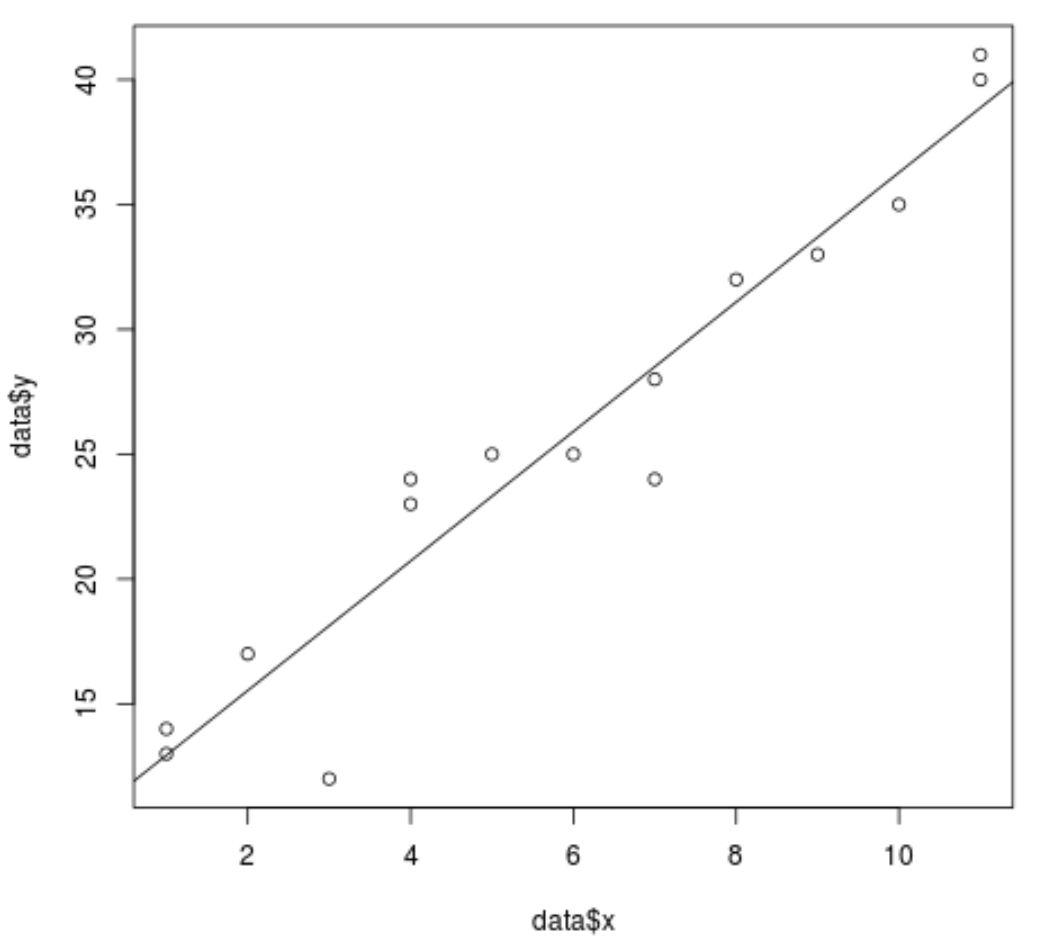
また、 predict()関数を使用してプロットに信頼区間線を追加することもできます。
 #define range of x values
newx = seq(min(data$x),max(data$x),by = 1)

#find 95% confidence interval for the range of x values
conf_interval <- predict(model, newdata=data.frame(x=newx), interval="confidence",
                         level = 0.95)

#create scatterplot of values with regression line
plot(data$x, data$y)
abline(model)

#add dashed lines (lty=2) for the 95% confidence interval
lines(newx, conf_interval[,2], col="blue", lty=2)
lines(newx, conf_interval[,3], col="blue", lty=2)
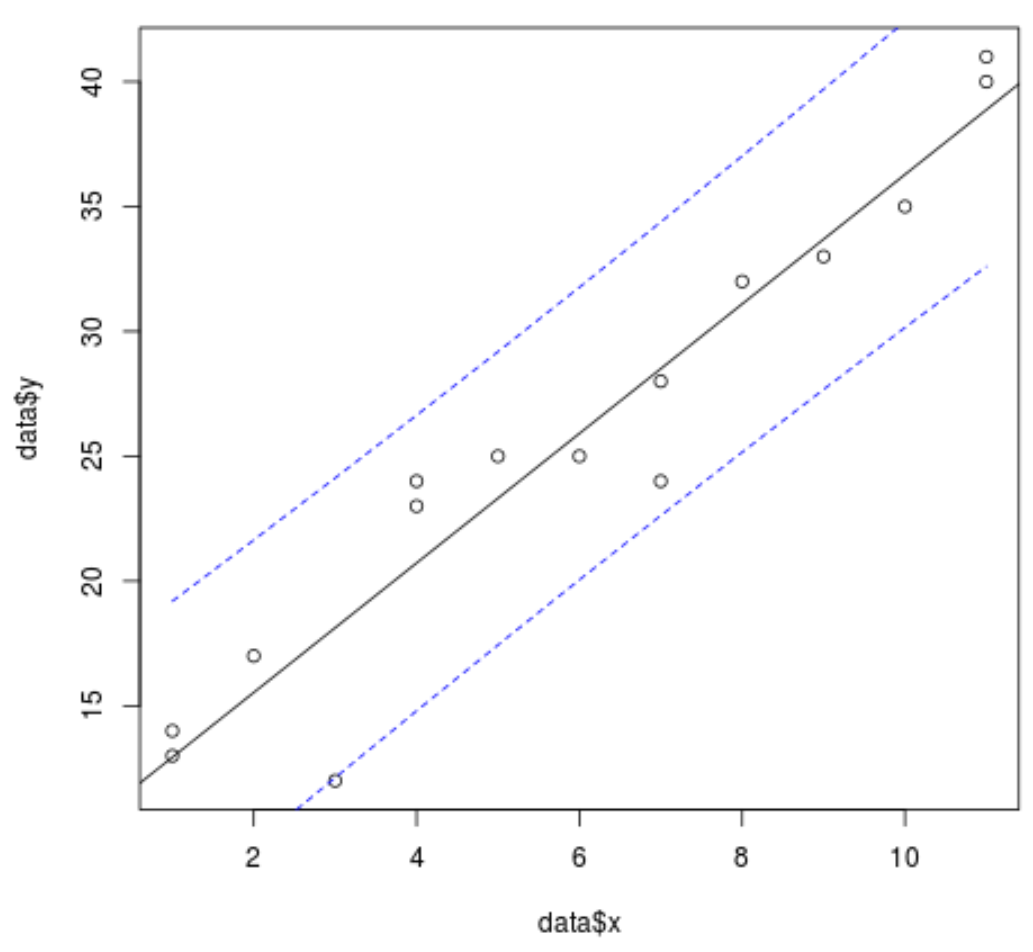
または、代わりに、 predict()関数で間隔タイプを指定することで、予測間隔ラインをプロットに追加することもできます。
 #define range of x values
newx = seq(min(data$x),max(data$x),by = 1)

#find 95% prediction interval for the range of x values
pred_interval <- predict(model, newdata=data.frame(x=newx), interval="prediction" ,
                         level = 0.95)

#create scatterplot of values with regression line
plot(data$x, data$y)
abline(model)

#add dashed lines (lty=2) for the 95% confidence interval
lines(newx, pred_interval[,2], col="red", lty=2)
lines(newx, pred_interval[,3], col="red", lty=2)
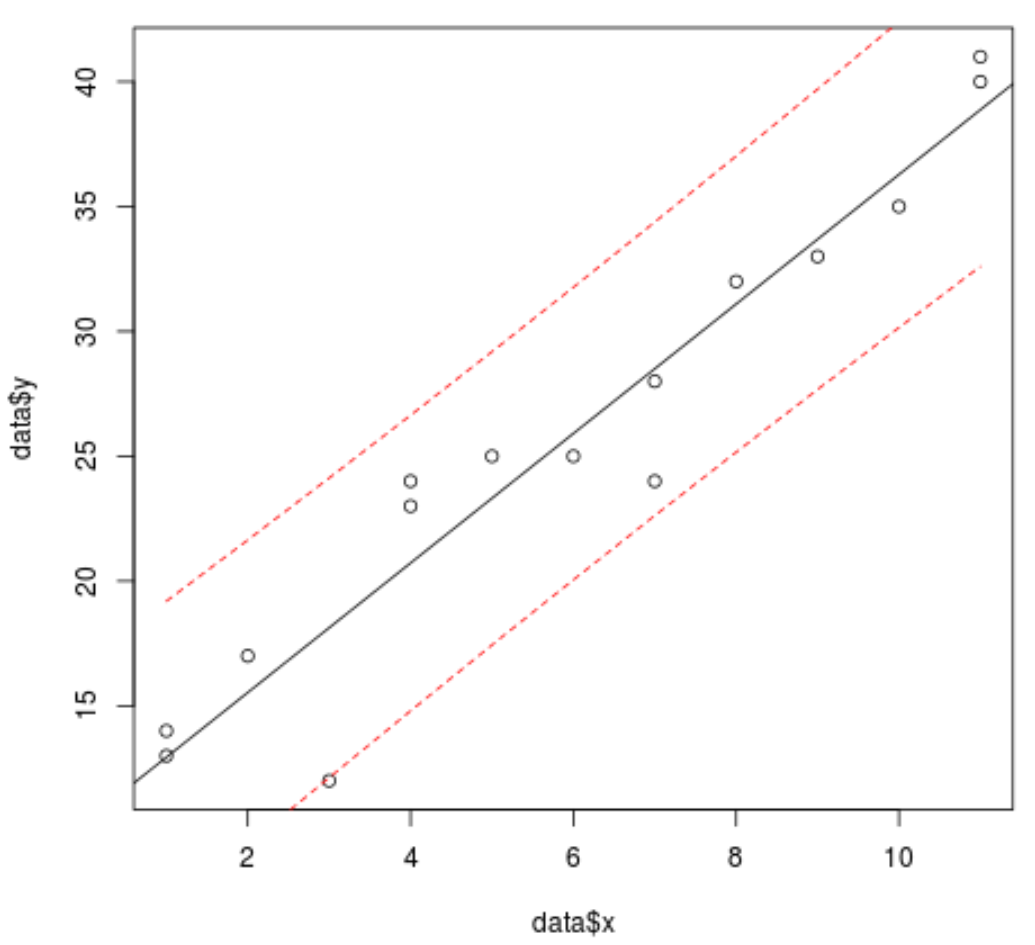
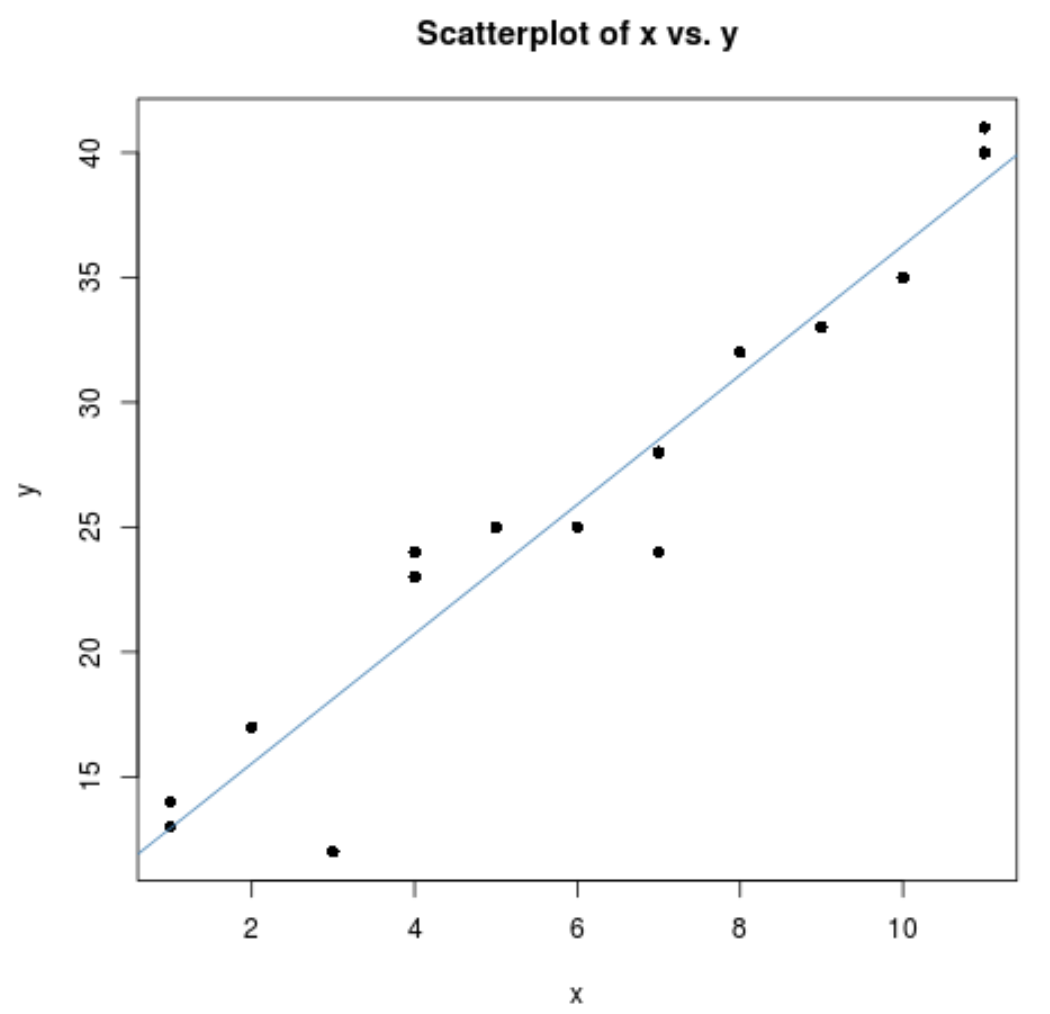
最後に、タイトルを追加し、軸の名前を変更し、個々のプロット ポイントの形状を変更することで、プロットをより美しくすることができます。
 plot(data$x, data$y,
     main = "Scatterplot of x vs. y", #add title
     pch=16, #specify points to be filled in
     xlab='x', #change x-axis name
ylab='y') #change y-axis name

abline(model, col='steelblue') #specify color of regression line
追加リソース
次のチュートリアルでは、R で他の一般的なタスクを実行する方法について説明します。