Ggplot2 で残差プロットを作成する方法 (例付き)
残差プロットは、回帰モデルの残差が正規分布しているかどうか、また残差が不均一分散性を示しているかどうかを評価するために使用されます。
ggplot2 で残差プロットを作成するには、次の基本構文を使用できます。
 library (ggplot2)

ggplot(model, aes(x = .fitted, y = .resid)) +
  geom_point() +
  geom_hline(yintercept = 0 )
次の例は、この構文を実際に使用する方法を示しています。
例: ggplot2 での残差プロットの作成
この例では、R に組み込まれているmtcarsデータセットを使用します。
 #view first six rows of mtcars dataset
head(mtcars)
                   mpg cyl disp hp drat wt qsec vs am gear carb
Mazda RX4 21.0 6 160 110 3.90 2.620 16.46 0 1 4 4
Mazda RX4 Wag 21.0 6 160 110 3.90 2.875 17.02 0 1 4 4
Datsun 710 22.8 4 108 93 3.85 2.320 18.61 1 1 4 1
Hornet 4 Drive 21.4 6 258 110 3.08 3.215 19.44 1 0 3 1
Hornet Sportabout 18.7 8 360 175 3.15 3.440 17.02 0 0 3 2
Valiant 18.1 6 225 105 2.76 3,460 20.22 1 0 3 1
まず、応答変数としてmpgを使用し、予測変数としてqsec を使用して回帰モデルを近似します。
 #fit regression model
model <- lm(mpg ~ qsec, data=mtcars)
次に、次の構文を使用して、ggplot2 で残差プロットを作成します。
 library (ggplot2)

#create residual plot
ggplot(model, aes(x = .fitted, y = .resid)) +
  geom_point() +
  geom_hline(yintercept = 0 )

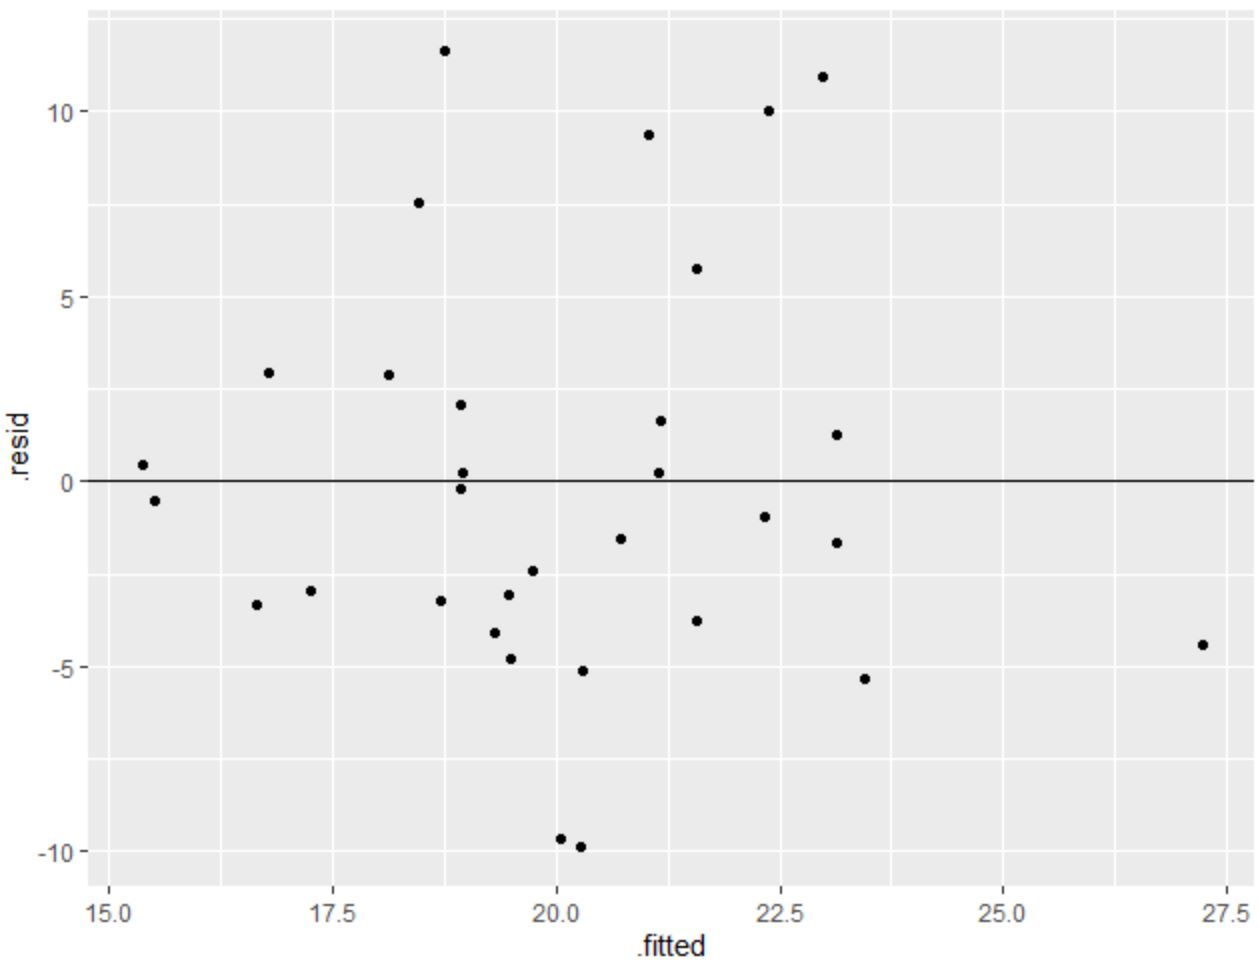
X 軸は近似値を表示し、Y 軸は残差を表示します。
残差は、明確なパターンがなくゼロの周囲にランダムに散在しているように見えます。これは、等分散性の仮定が満たされていることを示しています。
言い換えれば、回帰モデルの係数は信頼できるものである必要があり、データに対して変換を実行する必要はありません。
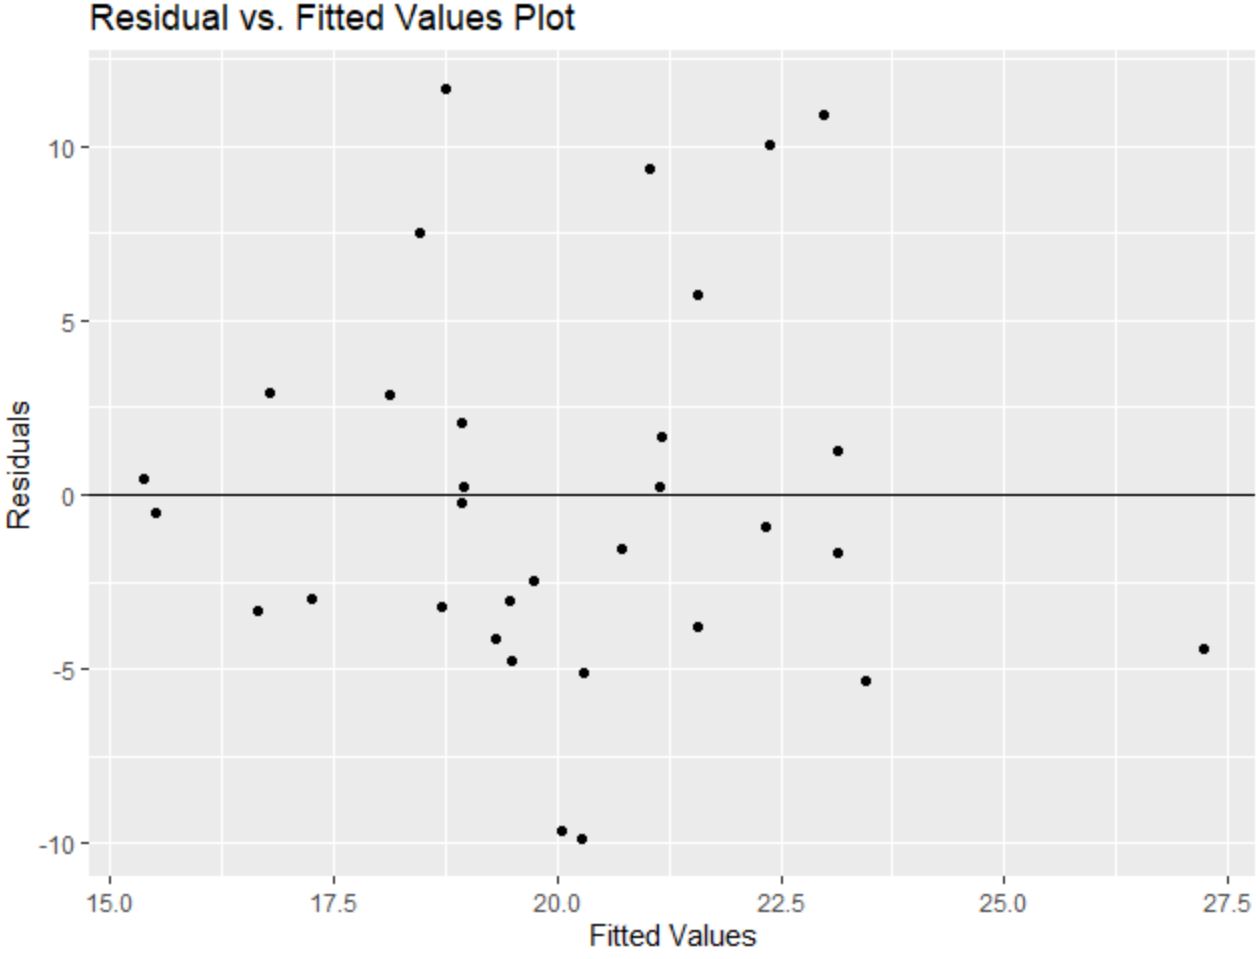
また、 labs()関数を使用してタイトルと軸のラベルを残差プロットに追加できることにも注意してください。
 library (ggplot2)

#create residual plot with title and axis labels
ggplot(model, aes(x = .fitted, y = .resid)) +
  geom_point() +
  geom_hline(yintercept = 0 ) +
  labs(title=' Residual vs. Fitted Values Plot ', x=' Fitted Values ', y=' Residuals ')

追加リソース
次のチュートリアルでは、R で他の一般的なタスクを実行する方法について説明します。