Python で最適な線を引く方法 (例付き)
次の基本構文を使用して、Python で最適な線を描画できます。
 #find line of best fit
a, b = np. polyfit (x, y, 1)

#add points to plot
plt. scatter (x,y)

#add line of best fit to plot
plt. plot (x, a*x+b)
次の例は、この構文を実際に使用する方法を示しています。
例 1: Python での最適なベースラインのプロット
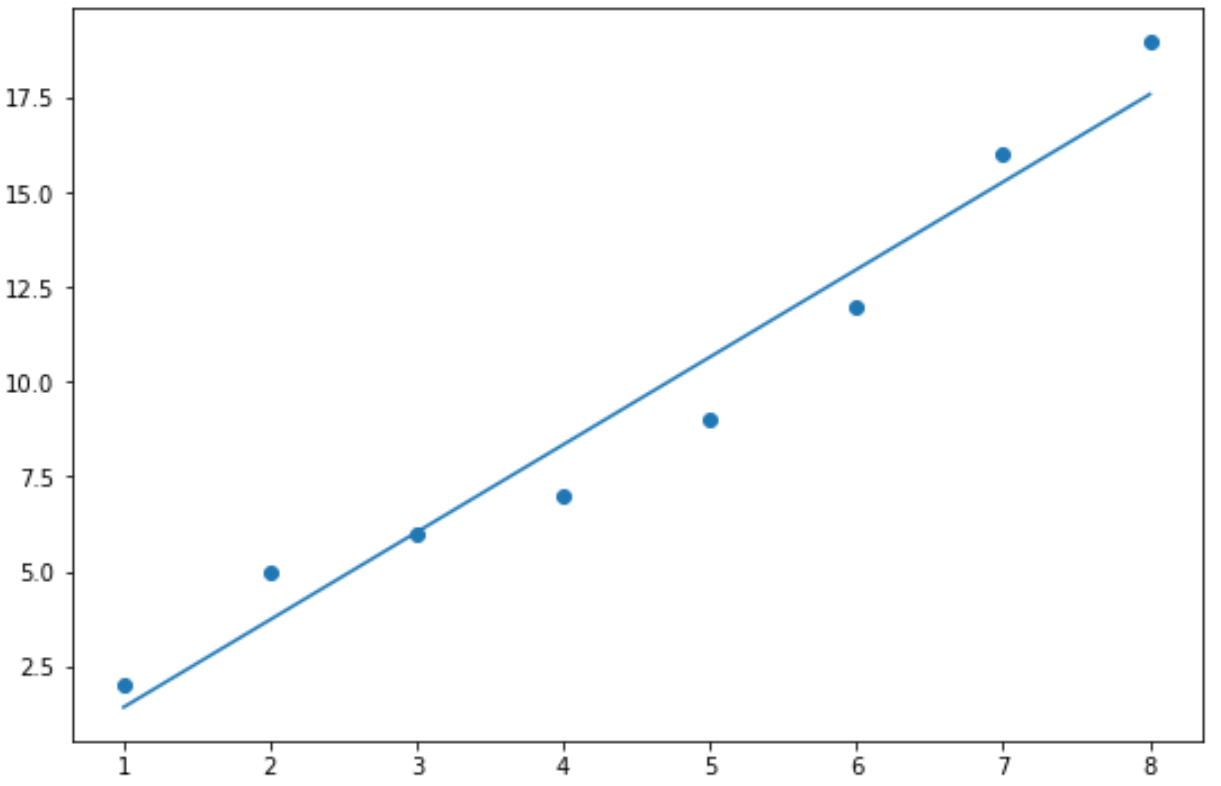
次のコードは、Python で最適なベースラインを描画する方法を示しています。
 import numpy as np
import matplotlib. pyplot as plt

#define data
x = np. array ([1, 2, 3, 4, 5, 6, 7, 8])
y = np. array ([2, 5, 6, 7, 9, 12, 16, 19])

#find line of best fit
a, b = np. polyfit (x, y, 1)

#add points to plot
plt. scatter (x,y)

#add line of best fit to plot
plt. plot (x, a*x+b)

例 2: Python で最適なカスタム ラインを描画する
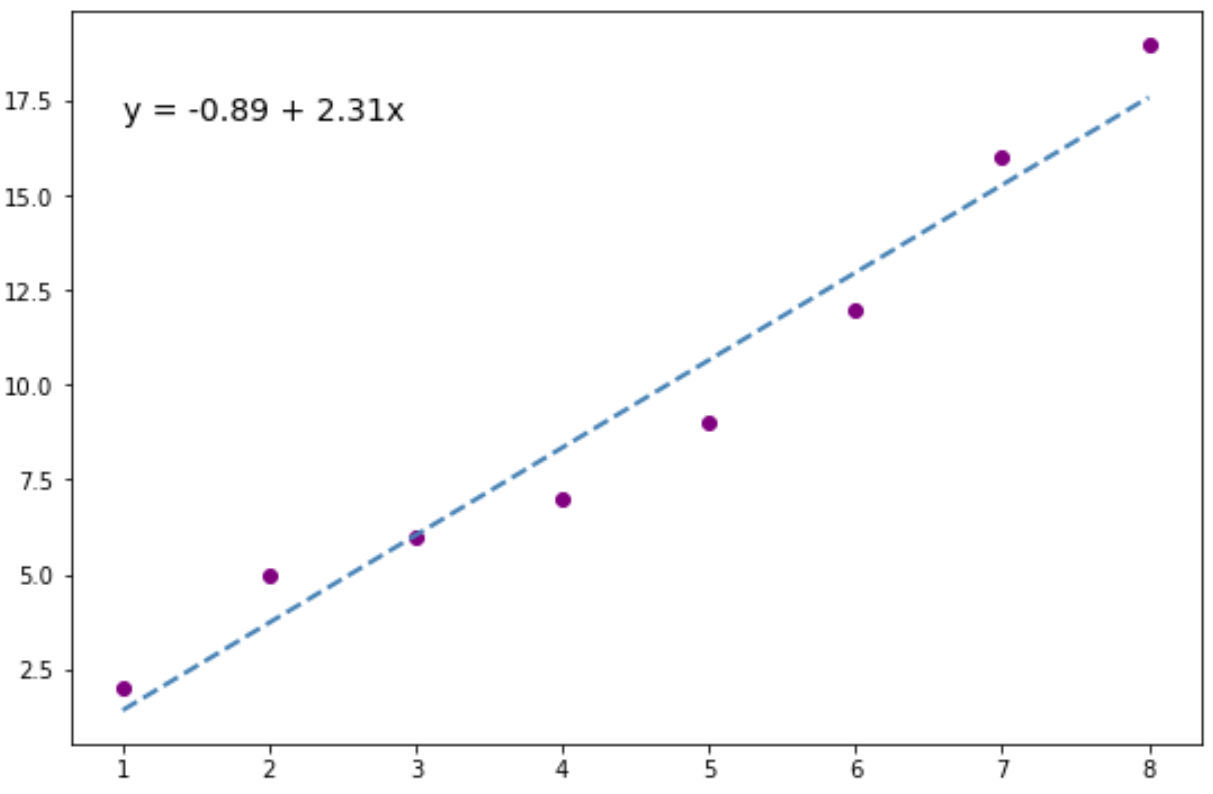
次のコードは、前の例と同じ最適な線を作成する方法を示していますが、次の点が追加されています。
- 点と最適な線のカスタムカラー
- カスタムスタイルと幅で最適なラインを実現
- プロット上に表示される近似回帰直線の方程式
 import numpy as np
import matplotlib. pyplot as plt

#define data
x = np. array ([1, 2, 3, 4, 5, 6, 7, 8])
y = np. array ([2, 5, 6, 7, 9, 12, 16, 19])

#find line of best fit
a, b = np. polyfit (x, y, 1)

#add points to plot
plt. scatter (x,y,color=' purple ')

#add line of best fit to plot
plt. plot (x, a*x+b, color=' steelblue ', linestyle=' -- ', linewidth= 2 )

#add fitted regression equation to plot
plt. text (1, 17, 'y = ' + '{:.2f}'. format (b) + ' + {:.2f}'. format (a) + 'x', size= 14 )

近似回帰式をプロット上の任意の(x,y)座標に自由に配置できます。
この特定の例では、(x, y) = (1, 17) を選択します。
追加リソース
次のチュートリアルでは、Python でさまざまな回帰モデルを適合する方法を説明します。