Ggplot2のgeom_hlineにラベルを追加する方法
次の基本構文を使用して、ggplot2 の水平線にラベルを追加できます。
+ annotate(" text ", x= 9 , y= 20 , label=" Here is my text ")
次の例は、この構文を実際に使用する方法を示しています。
例 1: geom_hline にラベルを追加する
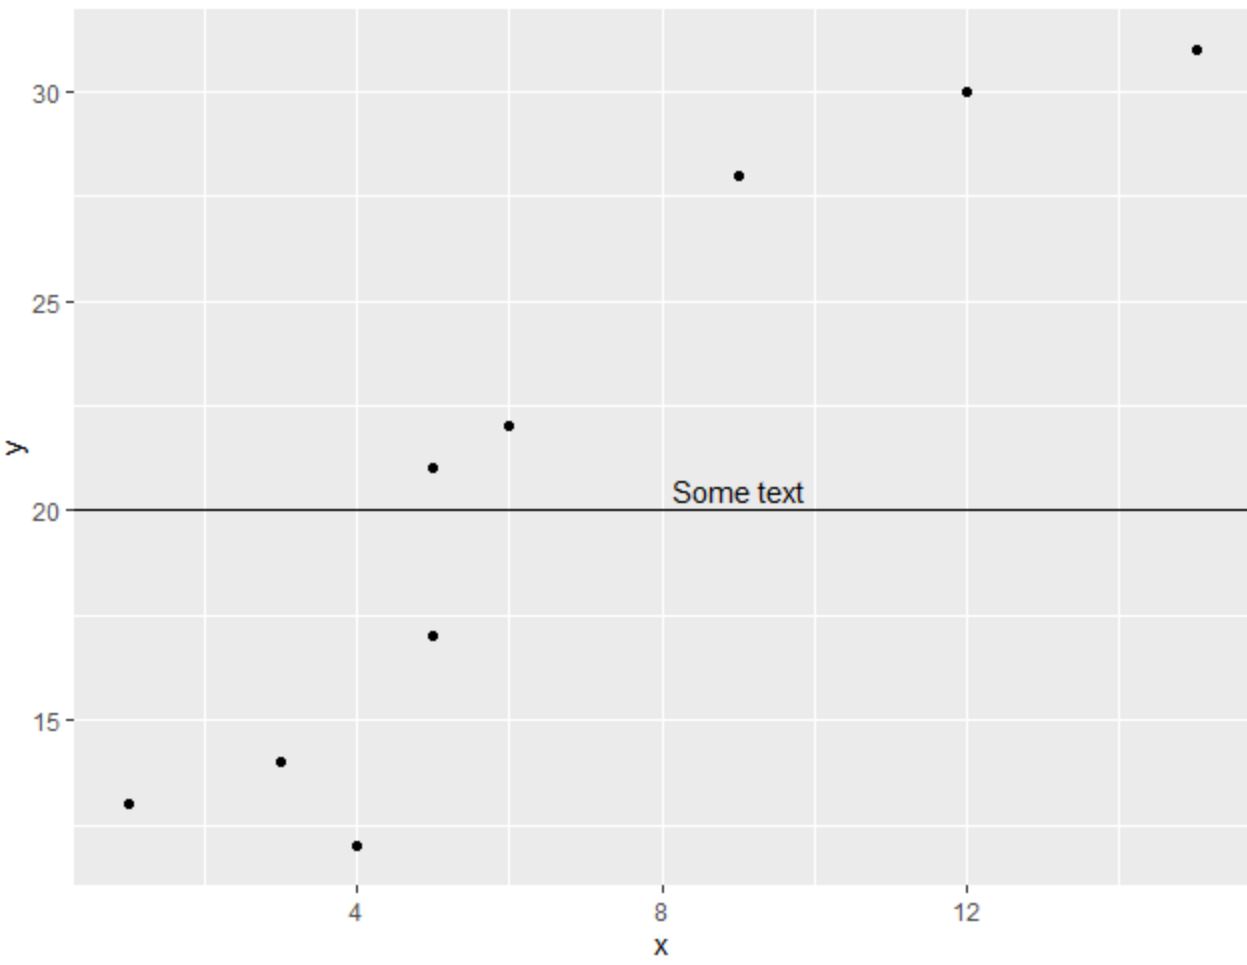
次のコードは、ggplot2 の水平線にラベルを追加する方法を示しています。
 library (ggplot2)

#create data frame
df <- data. frame (x=c(1, 3, 3, 4, 5, 5, 6, 9, 12, 15),
                 y=c(13, 14, 14, 12, 17, 21, 22, 28, 30, 31))

#create scatterplot with horizontal line at y=20
ggplot(df, aes(x=x, y=y)) +
geom_point() +
  geom_hline(yintercept= 20 ) +
  annotate("text", x= 9 , y= 20.5 , label=" Some text ")
例 2: geom_hline にカスタム ラベルを追加する
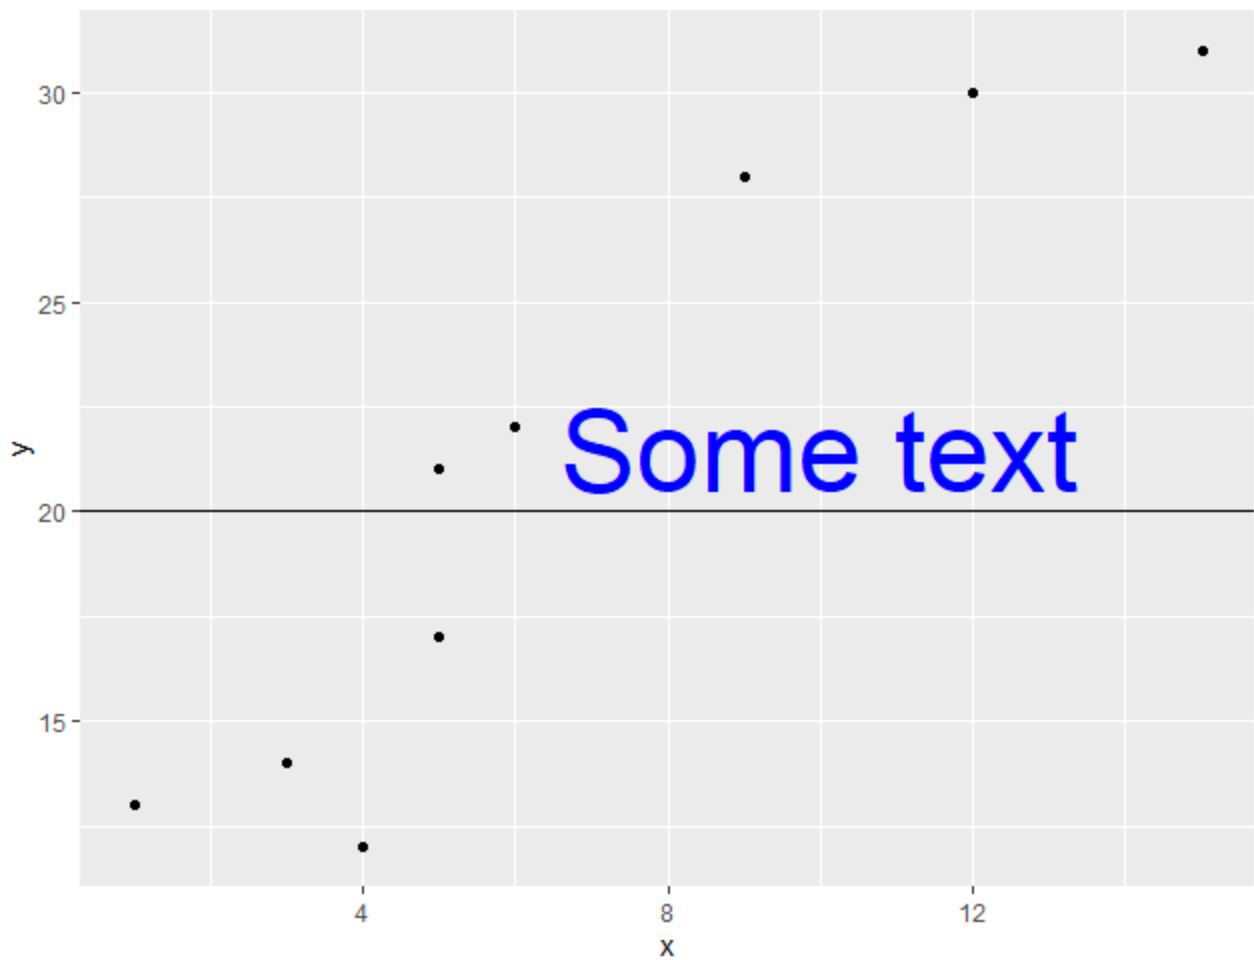
次のコードは、 size 引数とcolor引数を使用して、カスタム サイズと色のラベルを ggplot2 の水平線に追加する方法を示しています。
 library (ggplot2)

#create data frame
df <- data. frame (x=c(1, 3, 3, 4, 5, 5, 6, 9, 12, 15),
                 y=c(13, 14, 14, 12, 17, 21, 22, 28, 30, 31))

#create scatterplot with horizontal line at y=20
ggplot(df, aes(x=x, y=y)) +
geom_point() +
  geom_hline(yintercept= 20 ) +
  annotate("text", x= 10 , y= 21.5 , label=" Some text ", size= 15 , color=" blue ")
例 3: geom_hline に複数のラベルを追加する
次のコードは、 annotate()関数を複数回使用して、ggplot2 の水平線に複数のラベルを追加する方法を示しています。
 library (ggplot2)

#create data frame
df <- data. frame (x=c(1, 3, 3, 4, 5, 5, 6, 9, 12, 15),
                 y=c(13, 14, 14, 12, 17, 21, 22, 28, 30, 31))

#create scatterplot with horizontal line at y=10
ggplot(df, aes(x=x, y=y)) +
geom_point() +
  geom_hline(yintercept= 20 ) +
  annotate("text", x= 10 , y= 19 , label=" Some text ", size= 15 , color=" blue ") +
  annotate("text", x= 10 , y= 21 , label=" More text ", size= 9 , color=" red ")
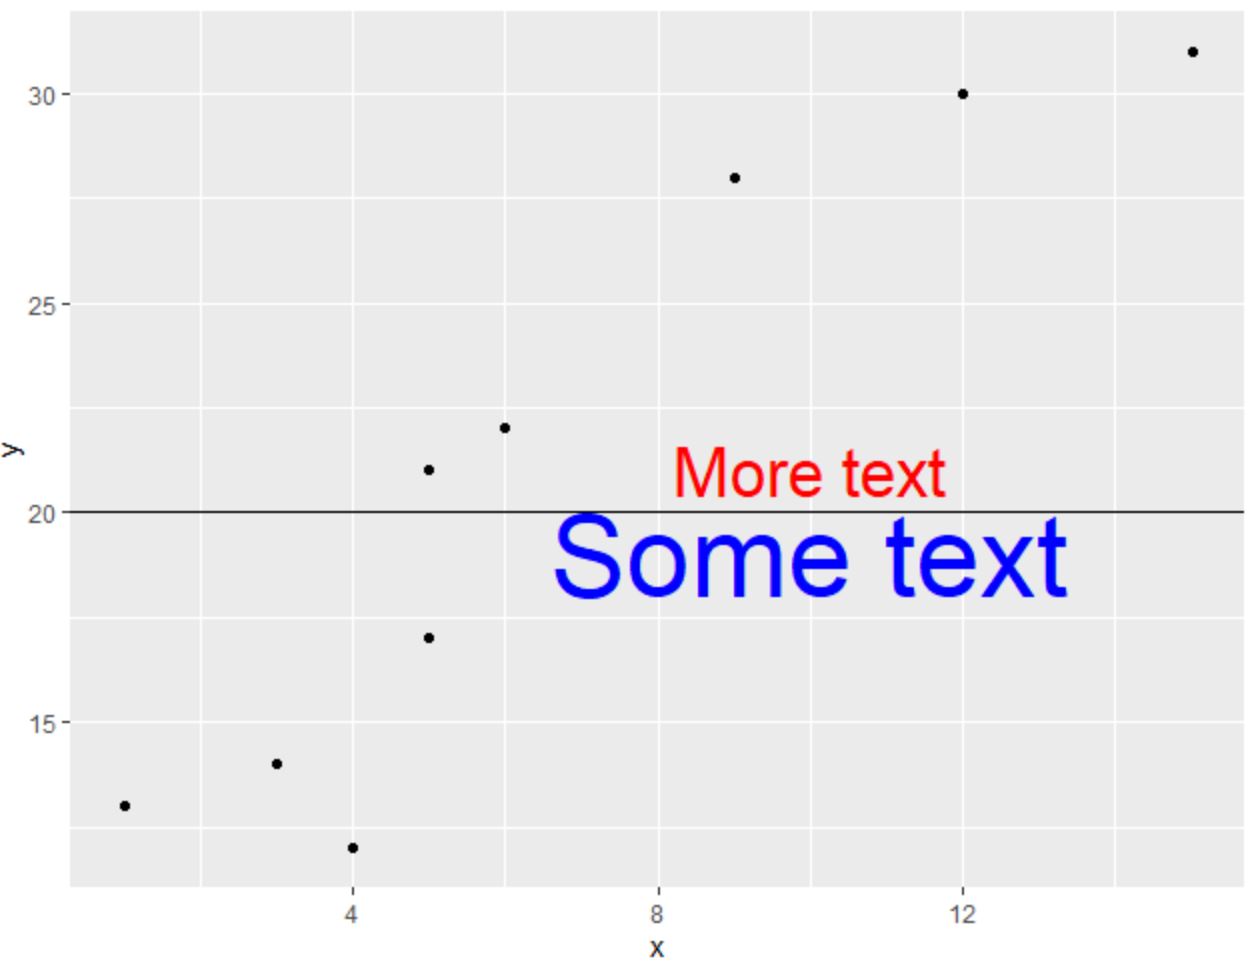
annotate()関数を何度でも自由に使用して、必要なだけラベルをプロットに追加できます。
追加リソース
次のチュートリアルでは、ggplot2 で他の一般的なタスクを実行する方法を説明します。
ggplot2 の geom_vline にラベルを追加する方法
ggplot2でプロットに平均線を追加する方法
ggplot2で線の色を変更する方法
著者について
ベンジャミン・アンダーソン博士
私はベンジャミンです。退職した統計教授から、専任の Statorials 教育者になりました。 統計分野における豊富な経験と専門知識を活かして、私は Statorials を通じて学生に力を与えるために自分の知識を共有することに尽力しています。もっと知る