Ggplot2を使用してプロットに水平線を追加する方法
次の構文を使用するgeom_hline()関数を使用すると、ggplot2 プロットに水平線をすばやく追加できます。
geom_hline(y切片、線種、色、サイズ)
金:
- yintercept: y 切片に線を追加する場所。
- 線種:線種。デフォルトは「solid」ですが、「twodash」、「longdash」、「dotted」、「dotdash」、「dash」、または「blank」を指定できます。
- color:線の色。
- サイズ:線の幅。
次の例は、この関数を実際に使用する方法を示しています。
パスに 1 本の水平線を追加します
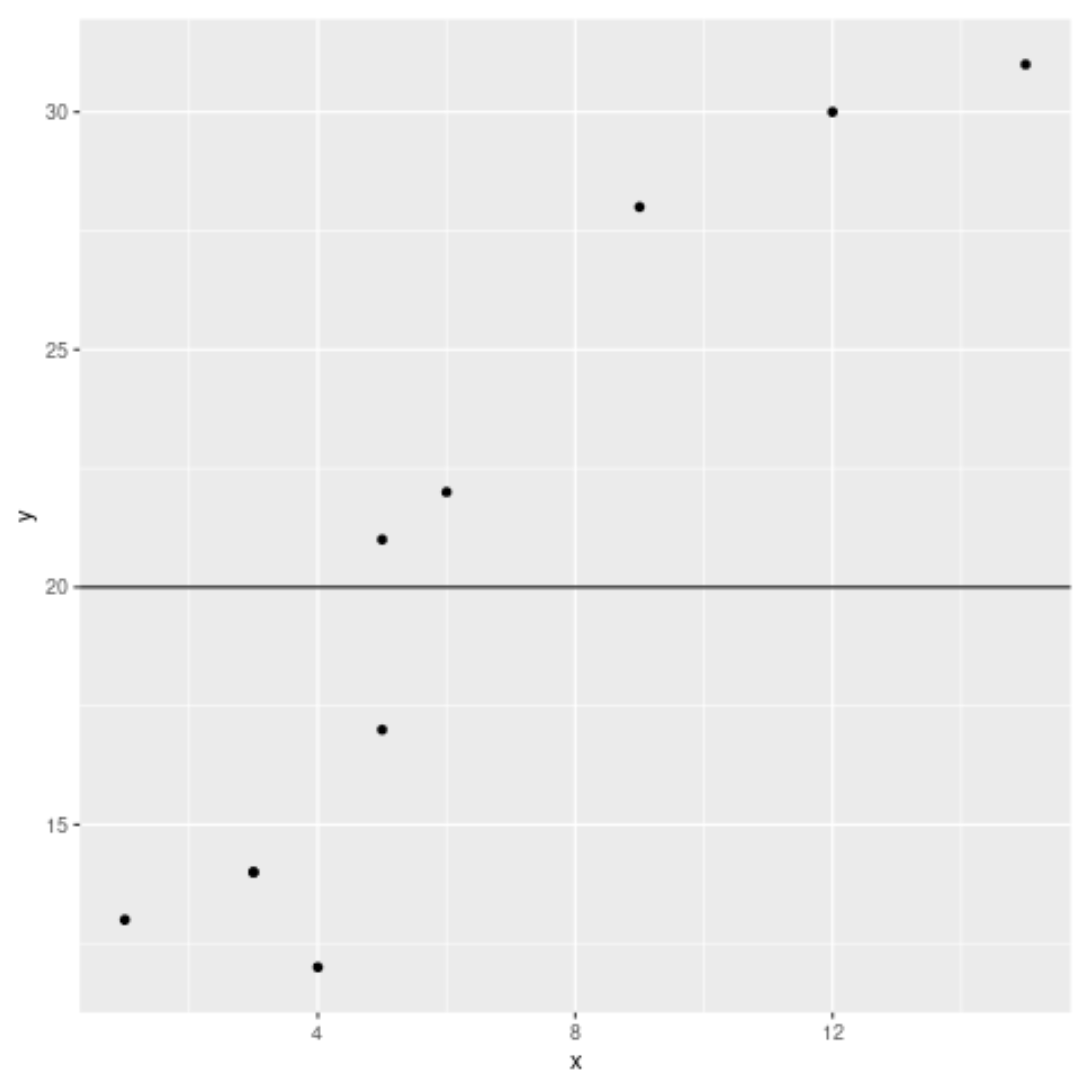
次のコードは、プロットに 1 本の水平線を追加する方法を示しています。
 library (ggplot2)

#create data frame
df <- data. frame (x=c(1, 3, 3, 4, 5, 5, 6, 9, 12, 15),
                 y=c(13, 14, 14, 12, 17, 21, 22, 28, 30, 31))

#create scatterplot with horizontal line at y=20
ggplot(df, aes (x=x, y=y)) +
  geom_point() +
  geom_hline(yintercept= 20 )

パスに複数の水平線を追加する
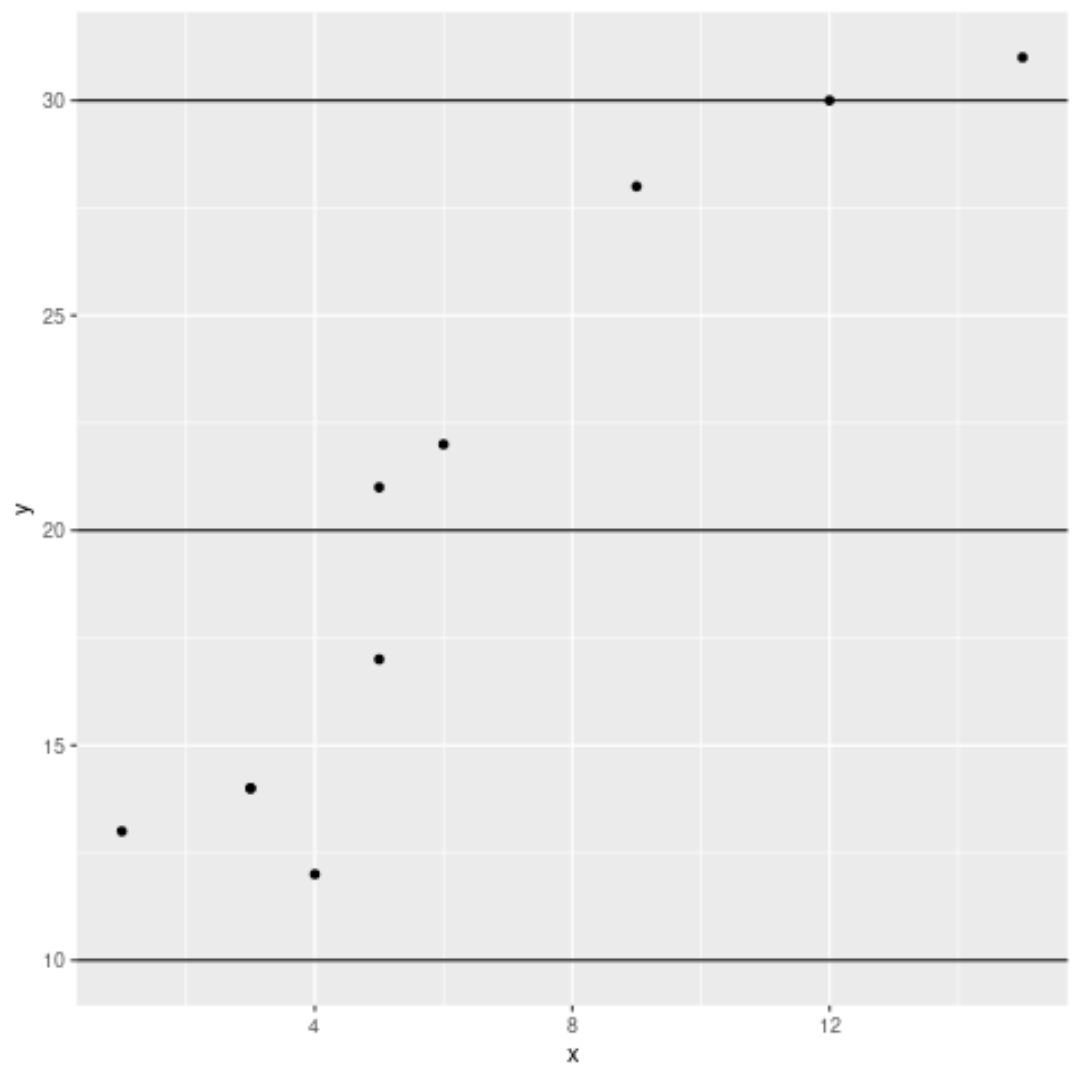
次のコードは、プロットに複数の水平線を追加する方法を示しています。
 library (ggplot2)

#create data frame
df <- data. frame (x=c(1, 3, 3, 4, 5, 5, 6, 9, 12, 15),
                 y=c(13, 14, 14, 12, 17, 21, 22, 28, 30, 31))

#create scatterplot with horizontal lines at y = 10, 20, 30
ggplot(df, aes (x=x, y=y)) +
  geom_point() +
  geom_hline(yintercept=c( 10, 20, 30 ))

水平線をカスタマイズする
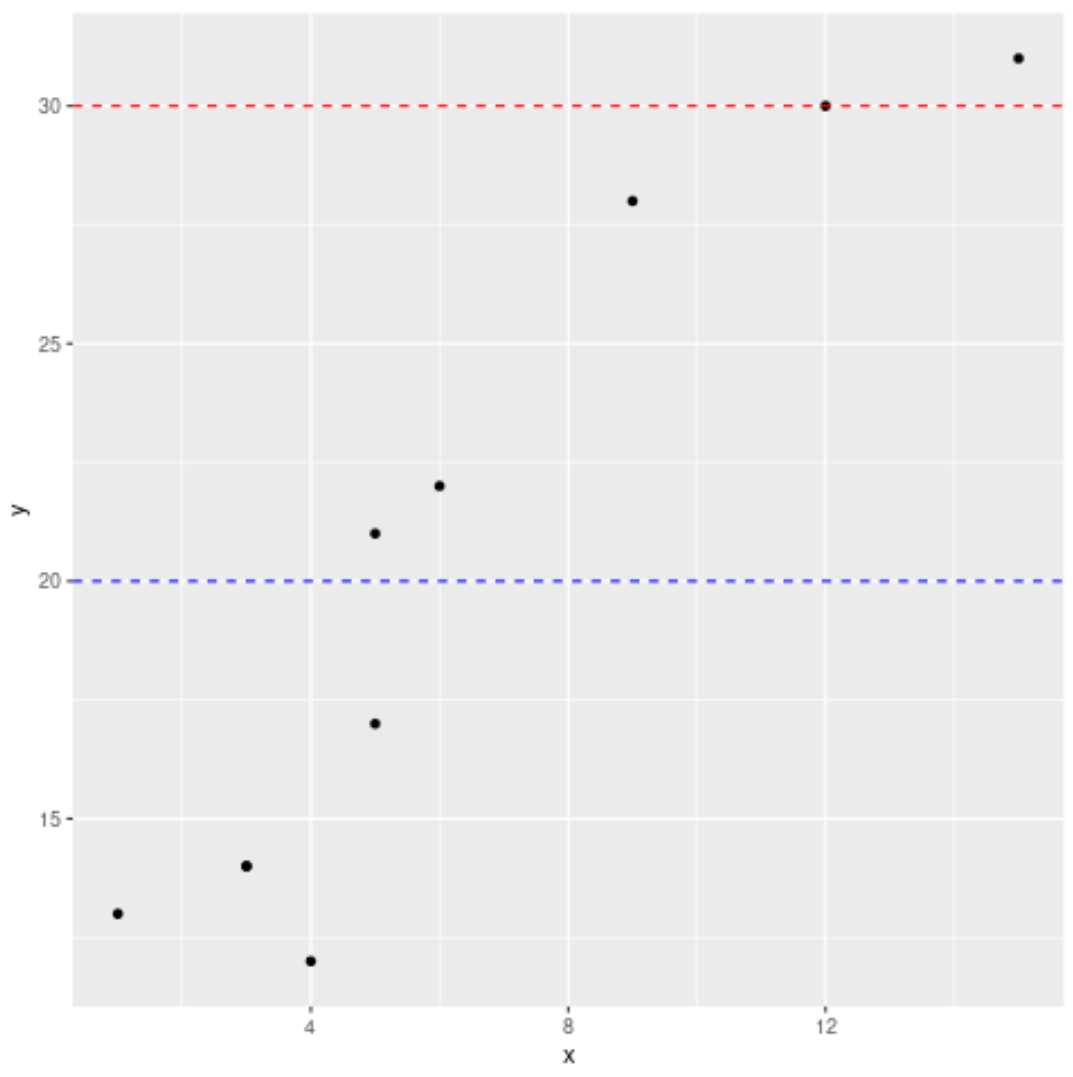
次のコードは、プロット上の水平線をカスタマイズする方法を示しています。
 library (ggplot2)

#create data frame
df <- data. frame (x=c(1, 3, 3, 4, 5, 5, 6, 9, 12, 15),
                 y=c(13, 14, 14, 12, 17, 21, 22, 28, 30, 31))

#create scatterplot with customized horizontal lines
ggplot(df, aes (x=x, y=y)) +
  geom_point() +
  geom_hline(yintercept=c( 20 , 30 ) , linetype=' dashed ', color=c(' blue ', ' red '))

追加リソース
ggplot2を使用してプロットに垂直線を追加する方法
ggplot2 で線形回帰直線をプロットする方法
ggplot2 で軸の制限を設定する方法