Ggplot2 で背景色を変更する方法 (例あり)
次の構文を使用して、ggplot2 プロット内のさまざまな要素の背景色を変更できます。
 p + theme(panel. background = element_rect(fill = ' lightblue ', color = ' purple '),
          panel. grid . major = element_line(color = ' red ', linetype = ' dotted '),
          panel. grid . minor = element_line(color = ' green ', size = 2 ))
組み込みの ggplot2 テーマを使用して、背景色を自動的に変更することもできます。最も一般的に使用されるテーマのいくつかを次に示します。
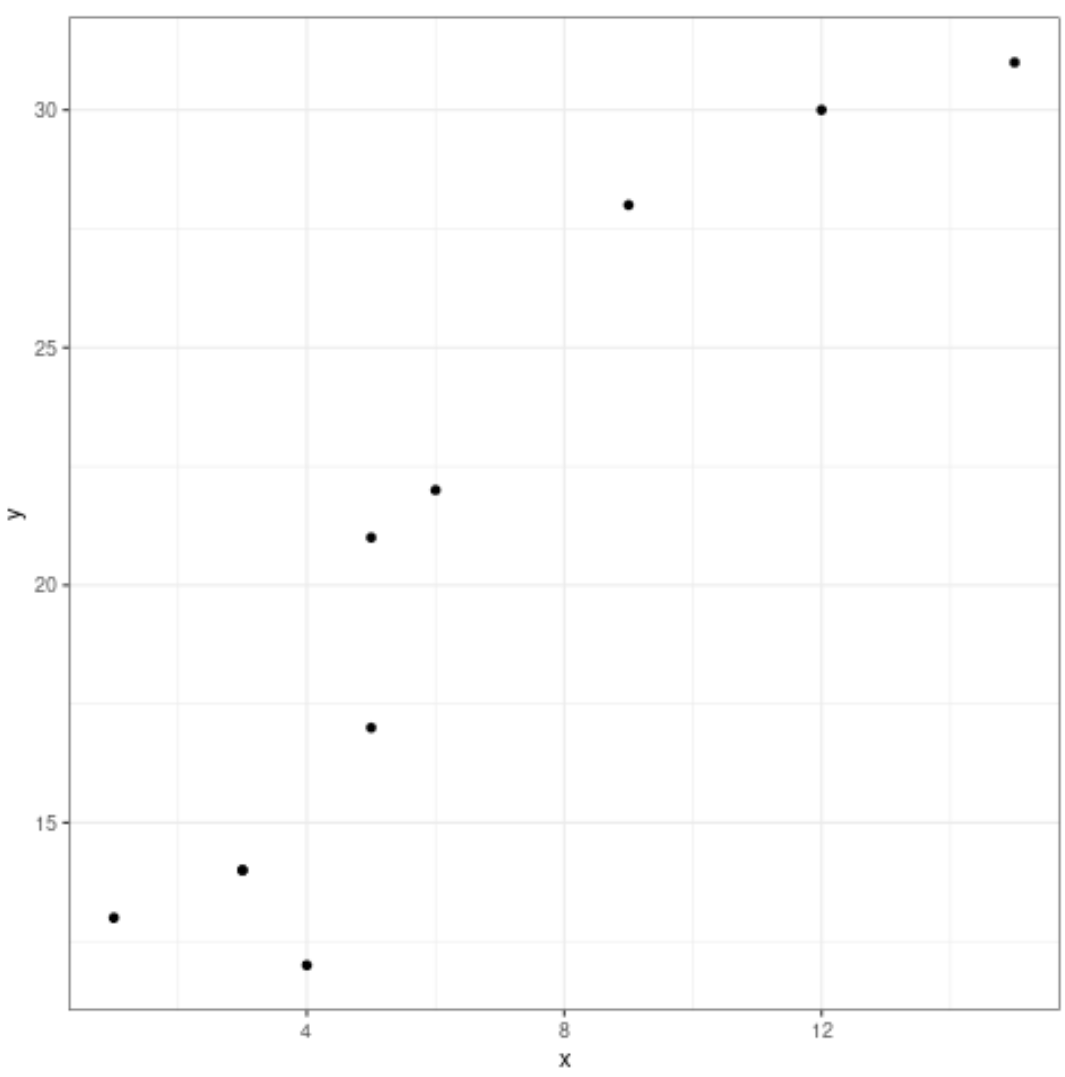
 p + theme_bw() #white background and gray gridlines
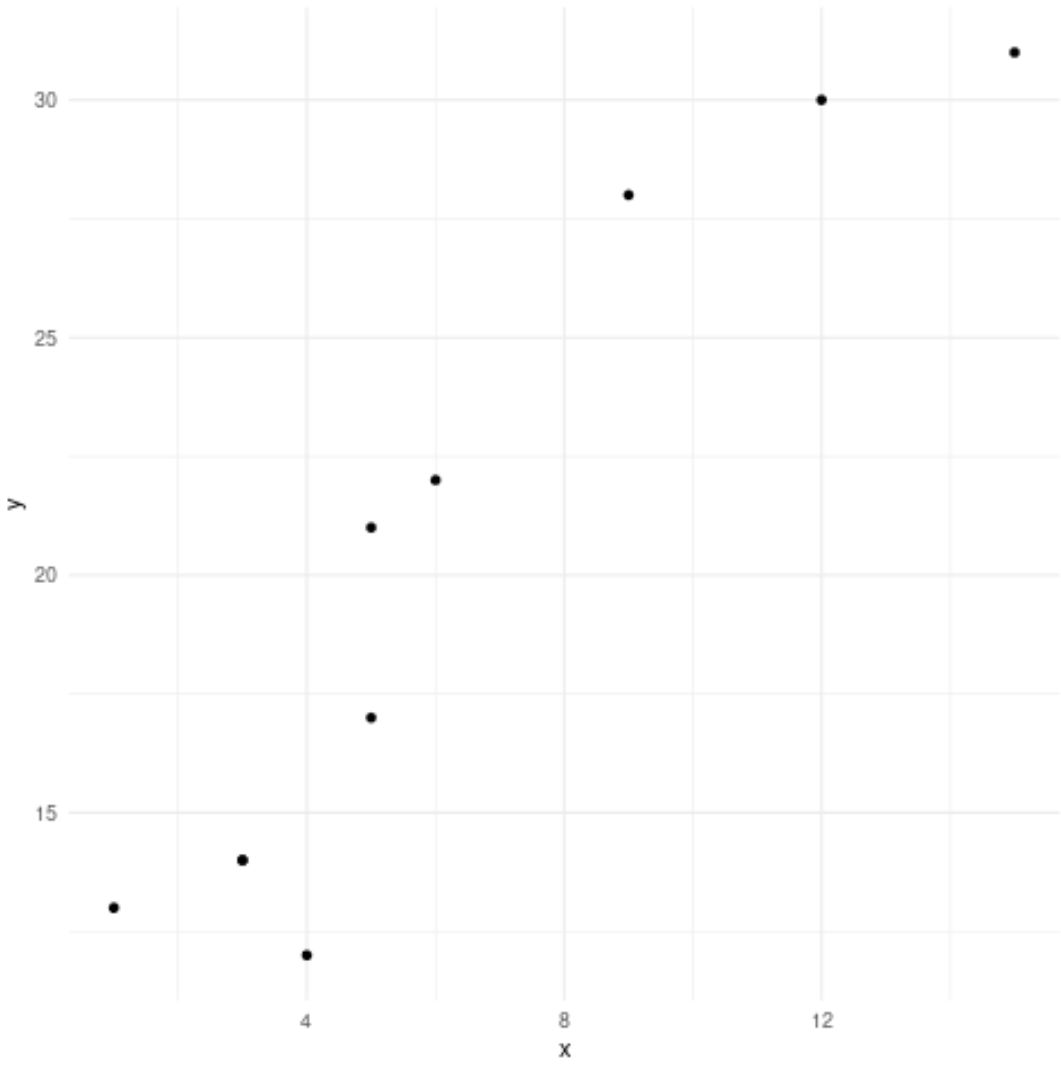
p + theme_minimal() #no background annotations
p + theme_classic() #axis lines but no gridlines
次の例は、この構文を実際に使用する方法を示しています。
例 1: カスタム背景色の指定
次のコードは、デフォルトの灰色の背景を使用して ggplot2 で基本的な散布図を作成する方法を示しています。
 library (ggplot2)

#create data frame
df <- data. frame (x=c(1, 3, 3, 4, 5, 5, 6, 9, 12, 15),
                 y=c(13, 14, 14, 12, 17, 21, 22, 28, 30, 31))

#create scatterplot
p <- ggplot(df, aes (x=x, y=y)) +
       geom_point()

#display scatterplot
p
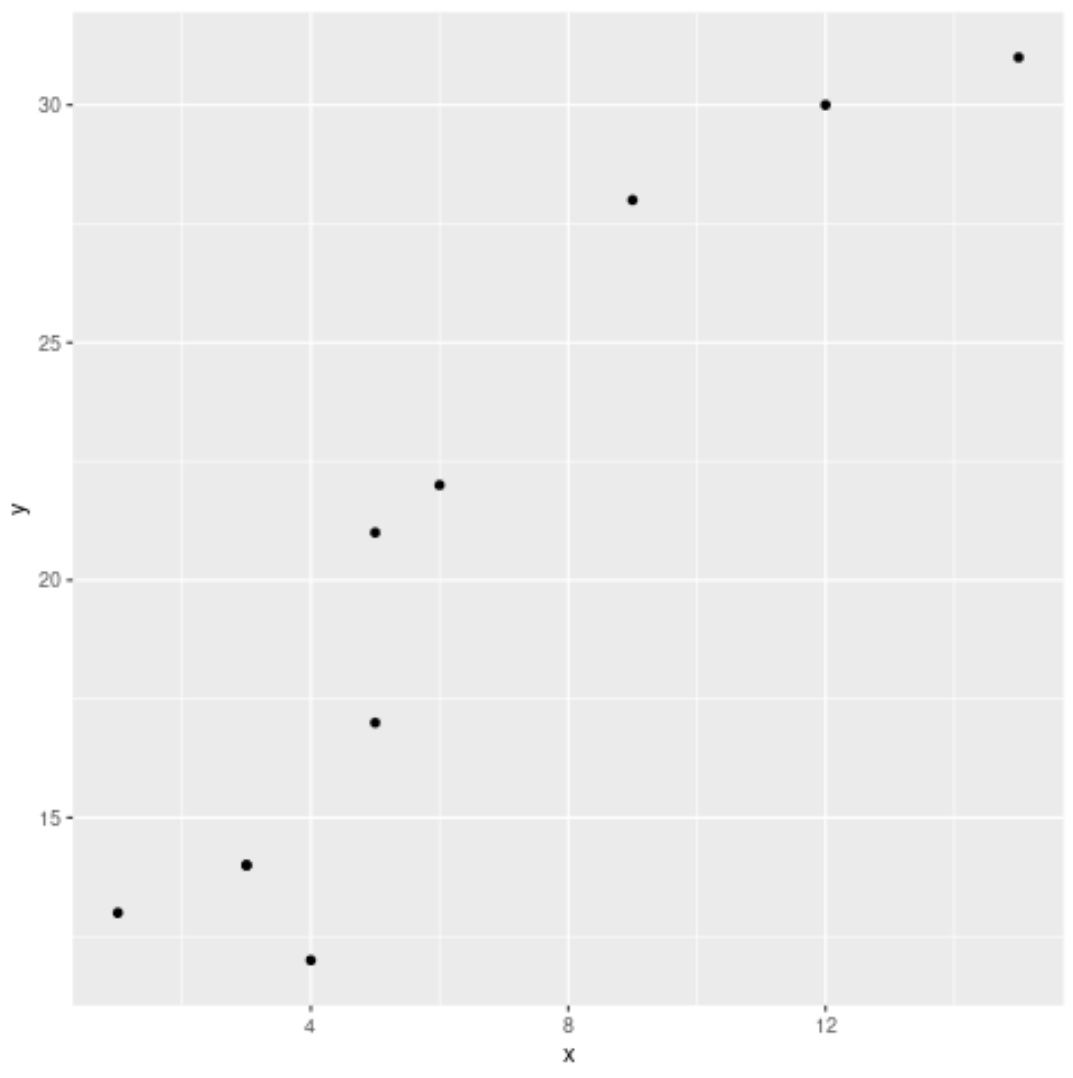
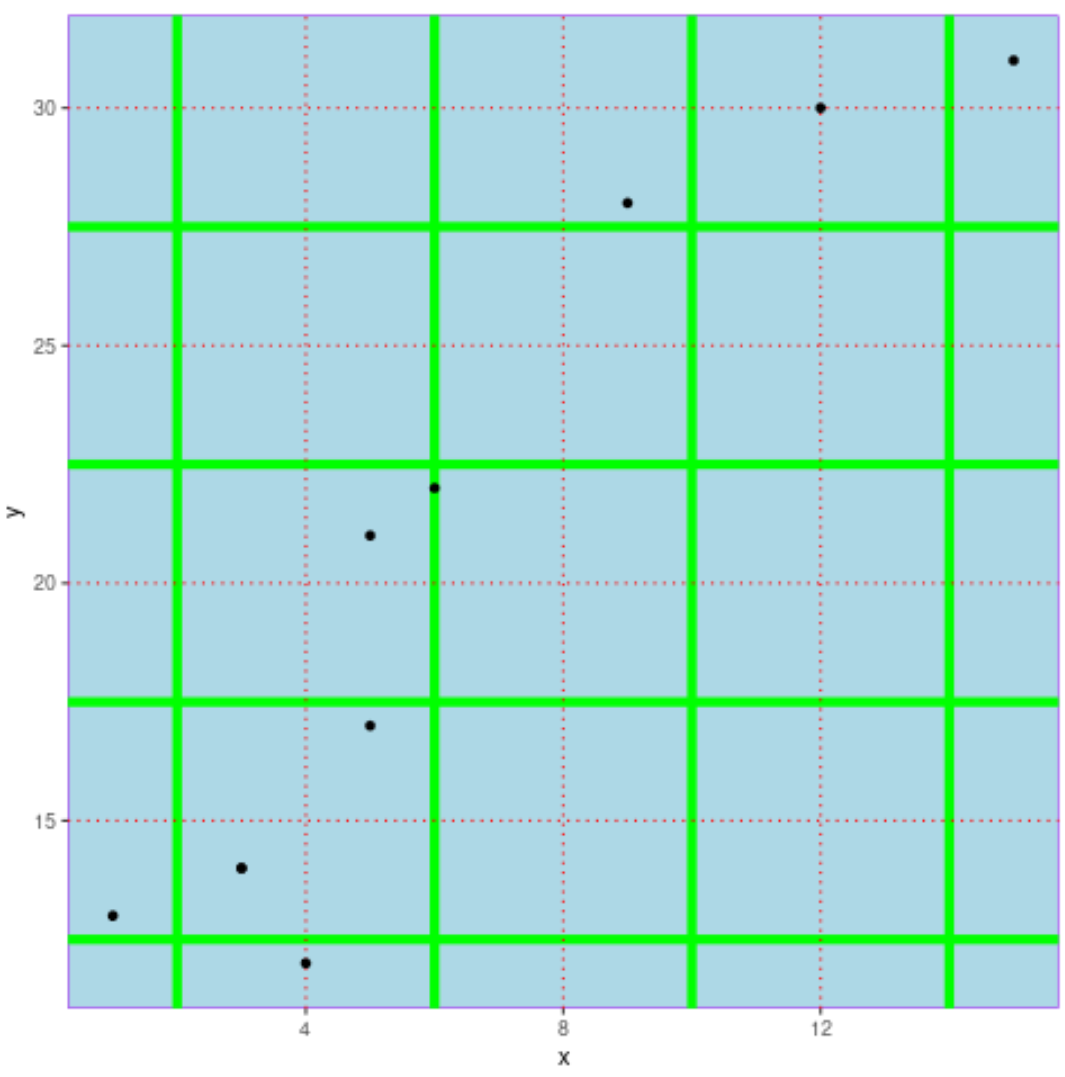
次のコードを使用して、パネルの背景色と主グリッド線と副グリッド線を変更できます。
 p + theme(panel. background = element_rect(fill = ' lightblue ', color = ' purple '),
          panel. grid . major = element_line(color = ' red ', linetype = ' dotted '),
          panel. grid . minor = element_line(color = ' green ', size = 2 ))
例 2: 組み込みテーマを使用して背景色を変更する
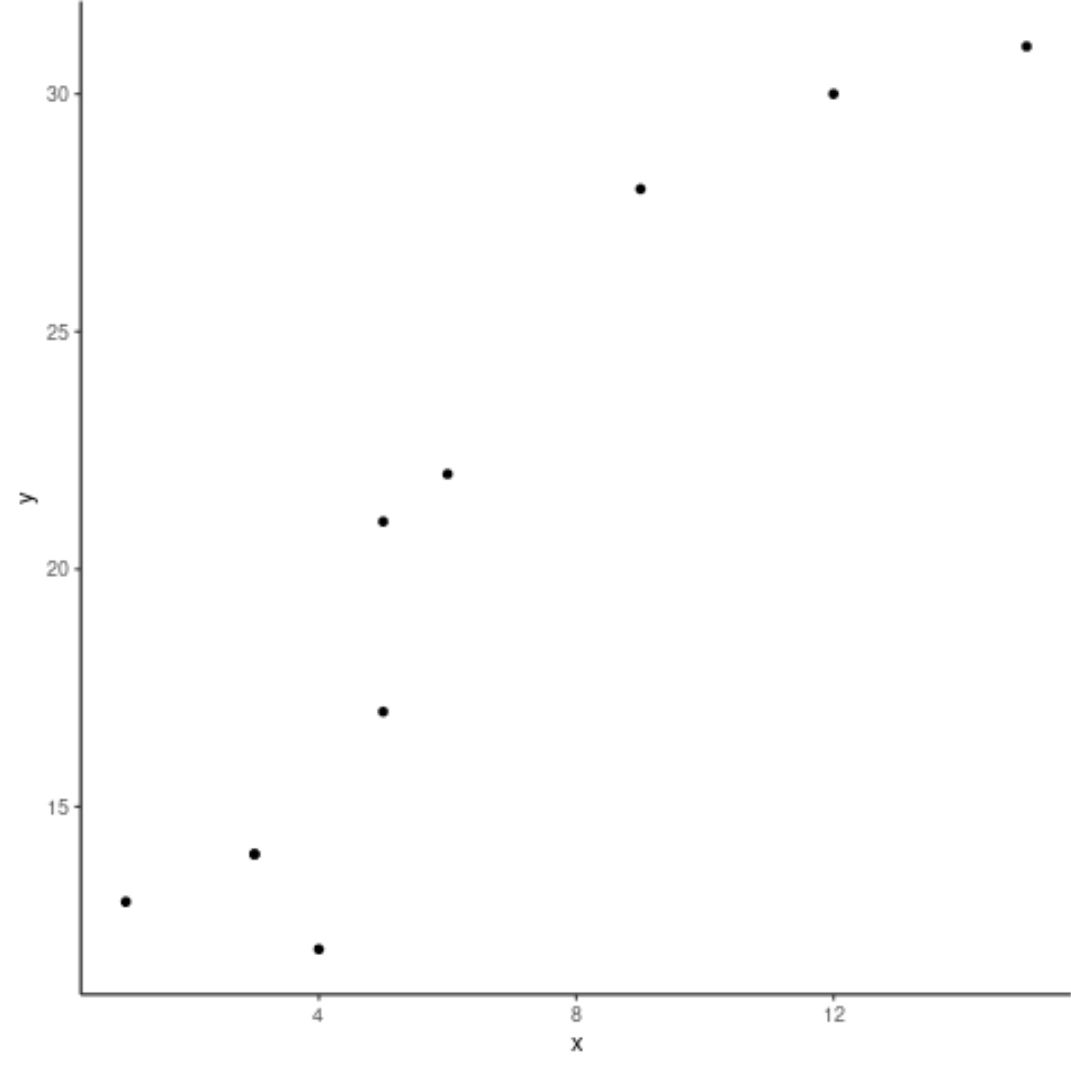
次のコードは、さまざまな組み込み ggplot2 テーマを使用して、プロットの背景色を自動的に変更する方法を示しています。
p + theme_bw() #white background and gray gridlines
p + theme_minimal() #no background annotations
p + theme_classic() #axis lines but no gridlines
追加リソース
ggplot2でグリッド線を削除する方法
ggplot2 で軸の制限を設定する方法
ggplot2で凡例の位置を変更する方法