Ggplot2 のプロットにテーブルを追加する方法 (2 つの例)
多くの場合、R の ggplot2 で作成されたプロットにテーブルを追加して、読者がプロットとともに生データを視覚化できるようにすることができます。
幸いなことに、ggpmisc パッケージを使用すると、プロットにテーブルを簡単に追加できます。
 install. packages (' ggpmisc ')
library (ggpmisc)
次の例は、このパッケージを使用して、次のデータ フレームを使用して棒グラフと散布図にテーブルを追加する方法を示しています。
 #create data frame
df <- data. frame (team=c('A', 'A', 'A', 'A', 'B', 'B', 'B', 'B'),
                 position=c('G', 'G', 'F', 'F', 'G', 'G', 'F', 'F'),
                 points=c(13, 23, 24, 20, 19, 14, 29, 31))

#view data frame
df

  team position points
1 AG 13
2 AG 23
3 AF 24
4 AF 20
5 BG 19
6 BG 14
7 BF 29
8 BF 31
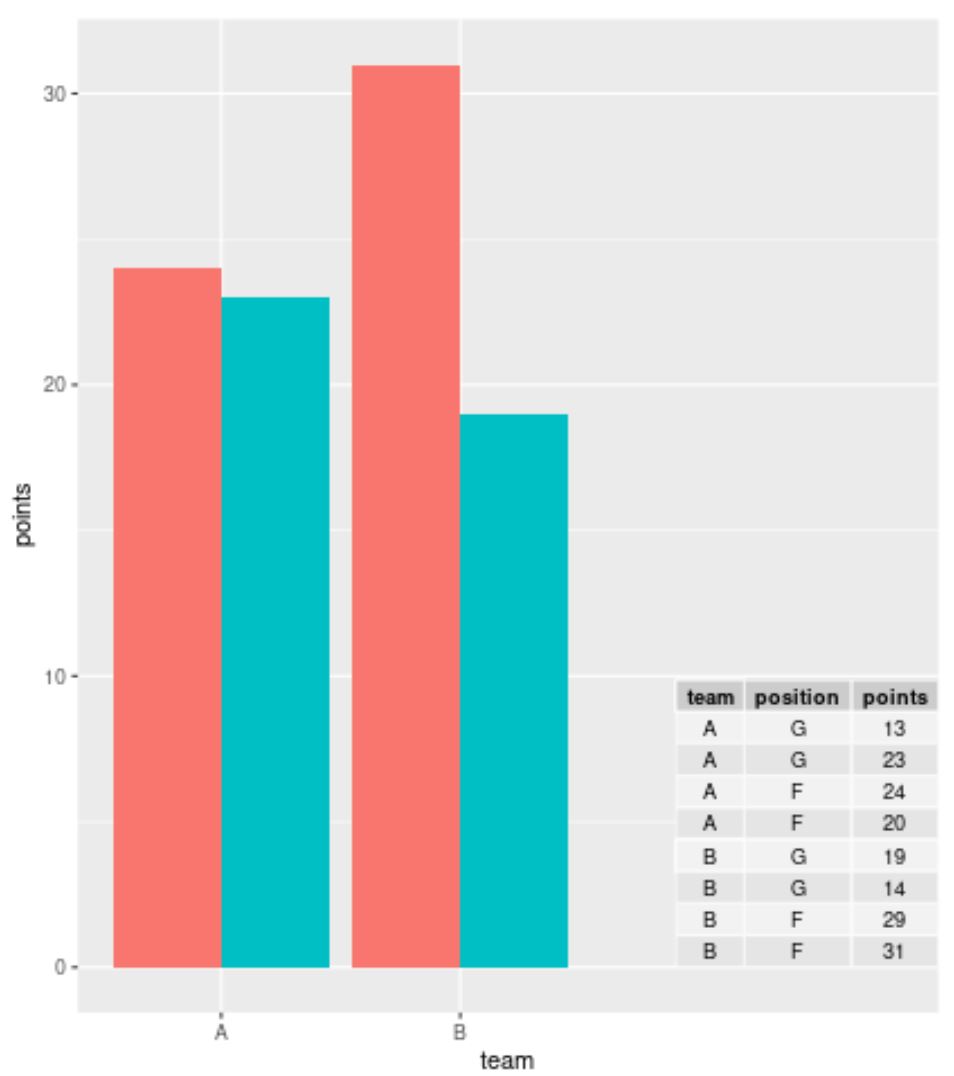
例 1: ggplot2 の Barplot にテーブルを追加する
次のコードを使用して、ggplot2 でグループ化された棒グラフを作成し、プロットの右下隅にテーブルを追加して、データ フレームの実際の値を表示できます。
 library (ggplo2)
library (ggpmisc)

#create barplot with table
ggplot(df, aes(x=team, y=points, fill=position)) +
    geom_bar(position=' dodge ', stat=' identity ') +
    annotate(geom = ' table ',
           x=4,
           y=0,
           label=list(df))

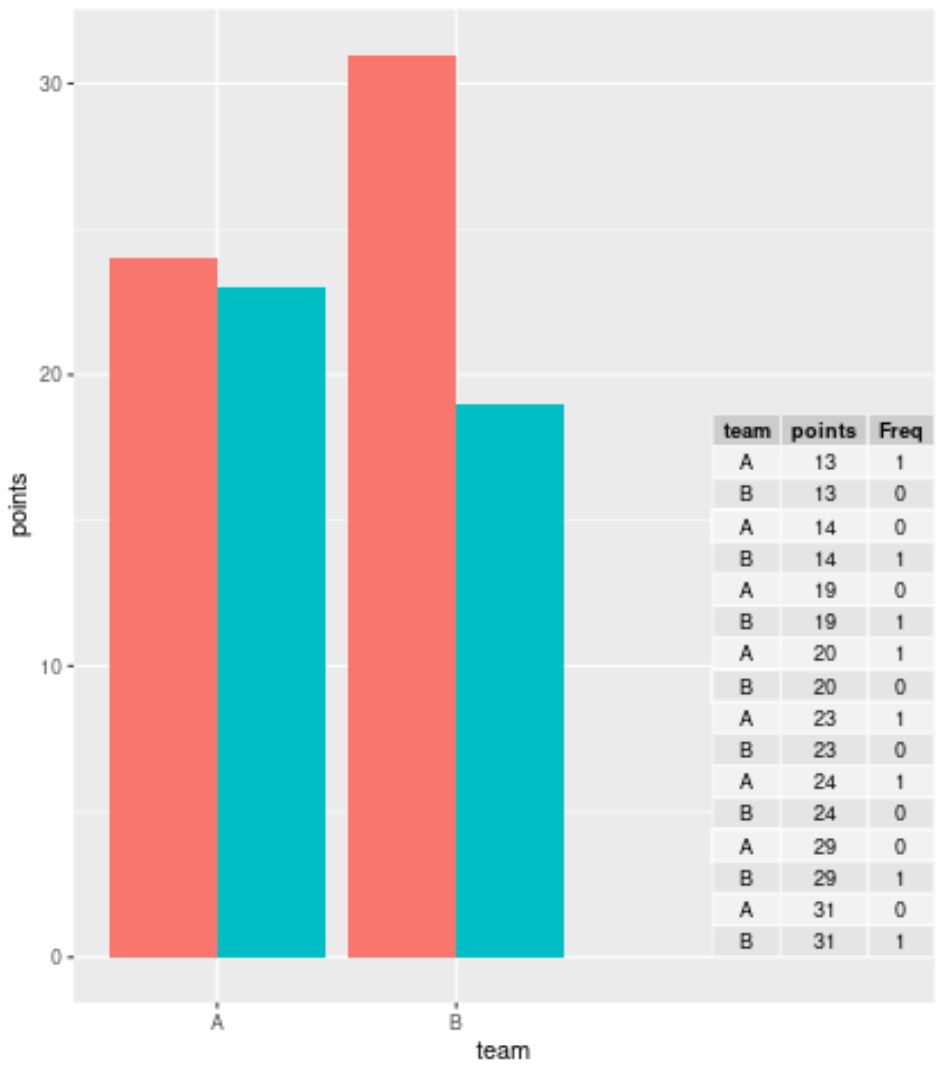
大規模なデータセットを操作していて、個々の行を表示したくない場合は、ggplot2 でテーブルを作成する前にtable()関数を使用してデータを要約できます。
 library (ggplot2)
library (ggpmisc)

#summarize frequencies of team and points in table
my_table <- as. data . frame (table(df[, c(1, 3)]))

#create barplot with table
ggplot(df, aes(x=team, y=points, fill=position)) +
    geom_bar(position=' dodge ', stat=' identity ') +
    annotate(geom = ' table ',
           x=4,
           y=0,
           label=list(my_table))

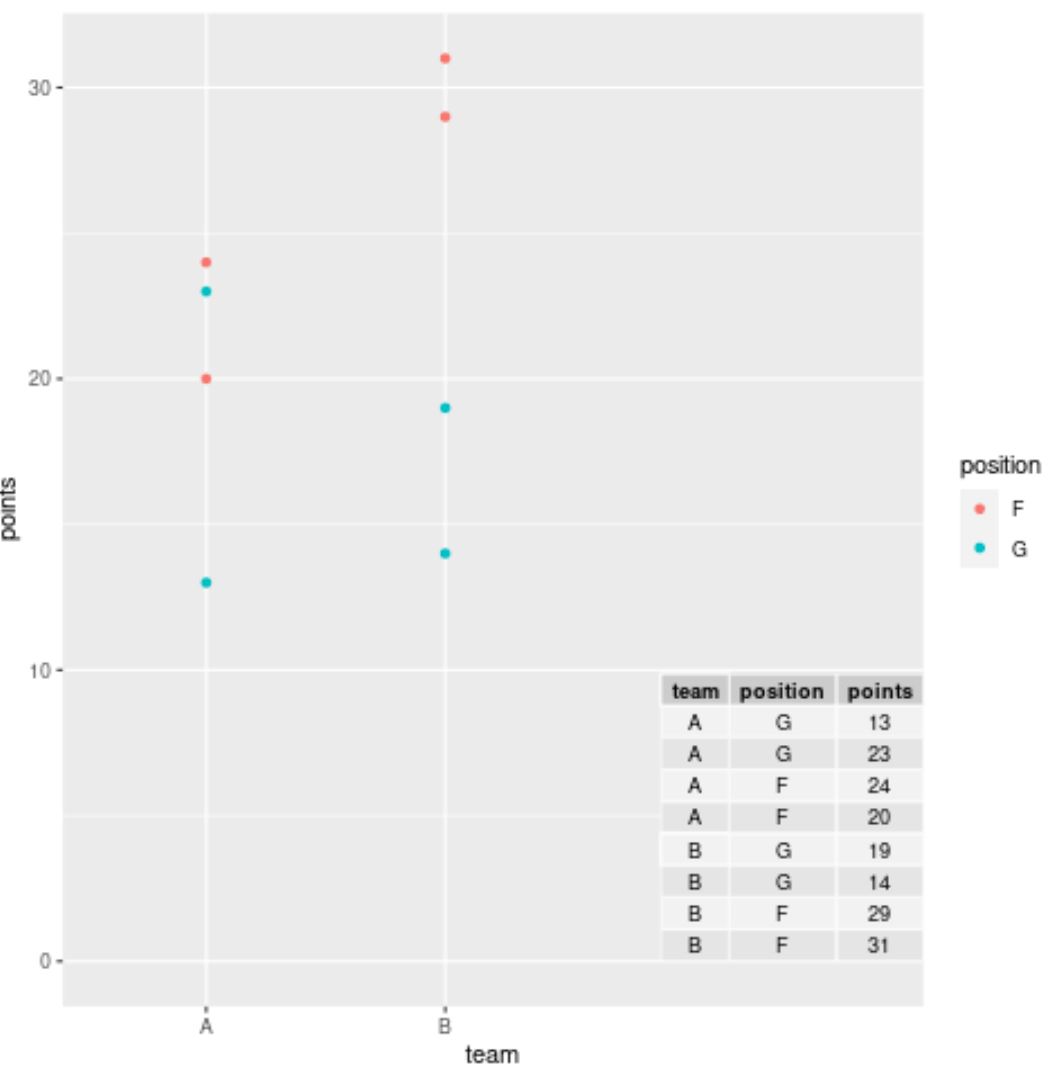
例 2: ggplot2 の散布図にテーブルを追加する
次のコードを使用して、ggplot2 で散布図を作成し、プロットの右下隅にテーブルを追加して、データ フレームからの実際の値を表示できます。
 library (ggplo2)
library (ggpmisc)

#create scatterplot with table
ggplot(df, aes(x=team, y=points)) +
    geom_point(aes(color=position)) +
    annotate(geom=' table ',
           x=4,
           y=0,
           label=list(df))

注: annotate()関数でx値とy値を自由に操作して、希望する正確な場所に配列を配置してください。
追加リソース
次のチュートリアルでは、ggplot2 で他の一般的なタスクを実行する方法を説明します。
ggplot2 プロットにテキストを追加する方法
ggplot2でタイトルの位置を変更する方法
ggplot2凡例の項目の順序を変更する方法