Ggplot2 で軸ラベルの位置を設定する方法 (例あり)
次の構文を使用して、ggplot2 の軸ラベルの位置を変更できます。
 theme(axis. title . x = element_text(margin=margin(t= 20 )), #add margin to x-axis title
      axis. title . y = element_text(margin=margin(r= 60 ))) #add margin to y-axis title
margin 引数には、上、右、下、左を意味するt 、 r 、 b 、 lを指定できることに注意してください。
次の例は、この構文を実際に使用する方法を示しています。
例 1: X 軸上のラベル位置を設定する
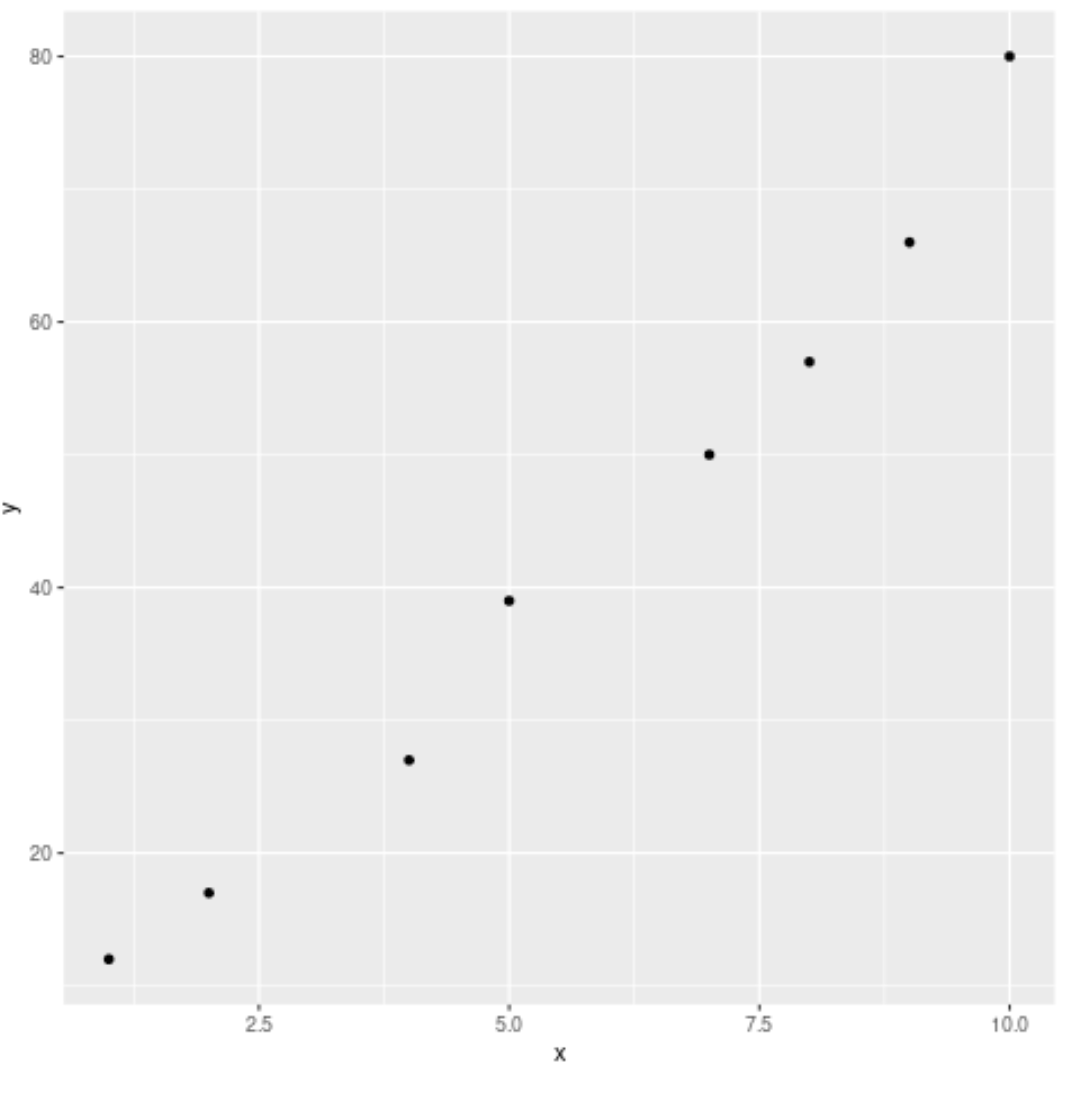
ggplot2 を使用して次の散布図を作成するとします。
 library (ggplot2)

#create data frame
df <- data. frame (x=c(1, 2, 4, 5, 7, 8, 9, 10),
                 y=c(12, 17, 27, 39, 50, 57, 66, 80))

#create scatterplot of x vs. y
ggplot(df, aes(x=x, y=y)) +
  geom_point()

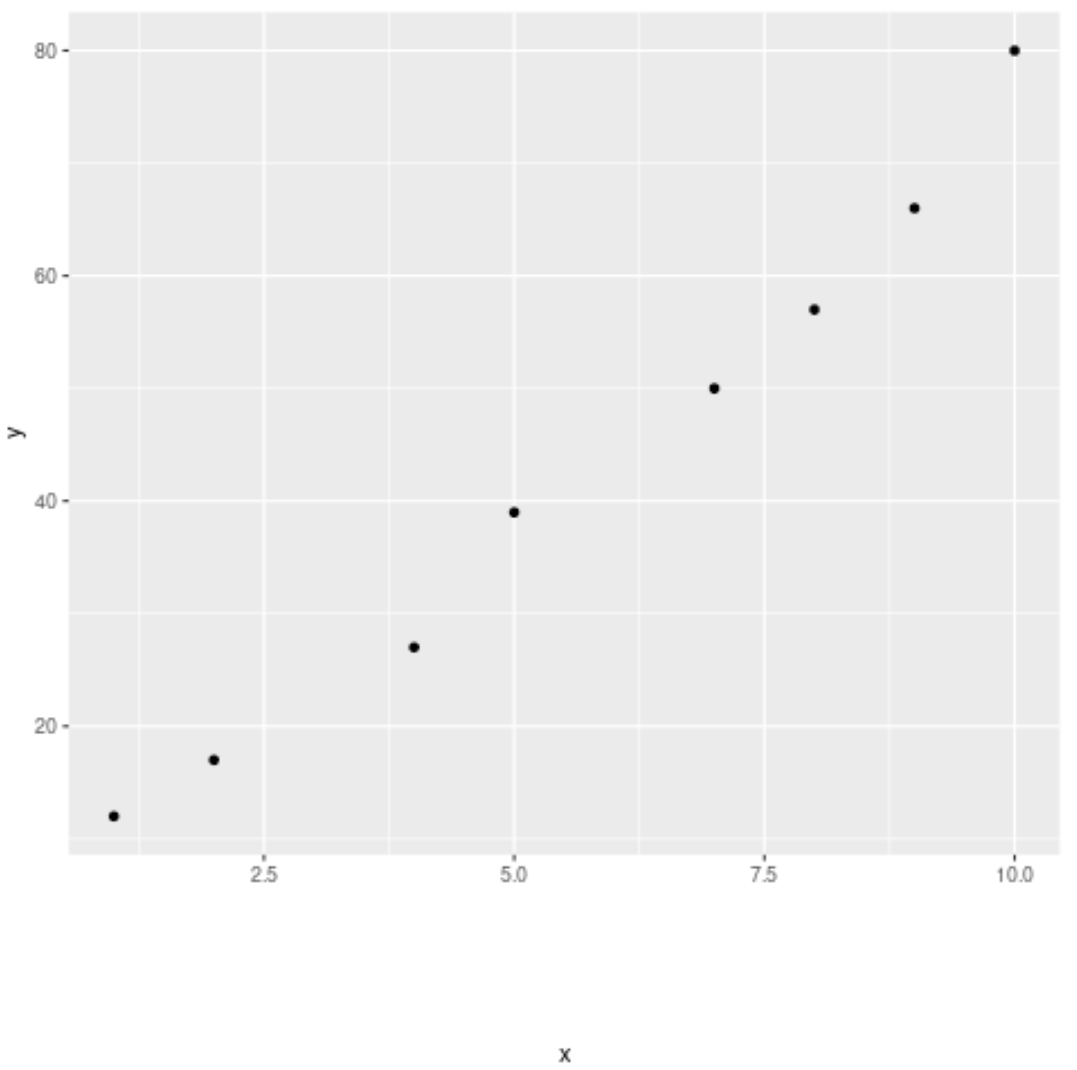
X 軸のタイトルの上部にマージンを追加して、X 軸のタイトルを軸から遠くに表示することができます。
 #create scatterplot of x vs. y with margin added on x-axis title
ggplot(df, aes(x=x, y=y)) +
  geom_point() +
  theme(axis. title . x = element_text(margin = margin(t = 70 )))

x 軸のタイトルと x 軸の間に大幅なスペースを追加したことに注意してください。
例 2: Y 軸上のラベル位置を設定する
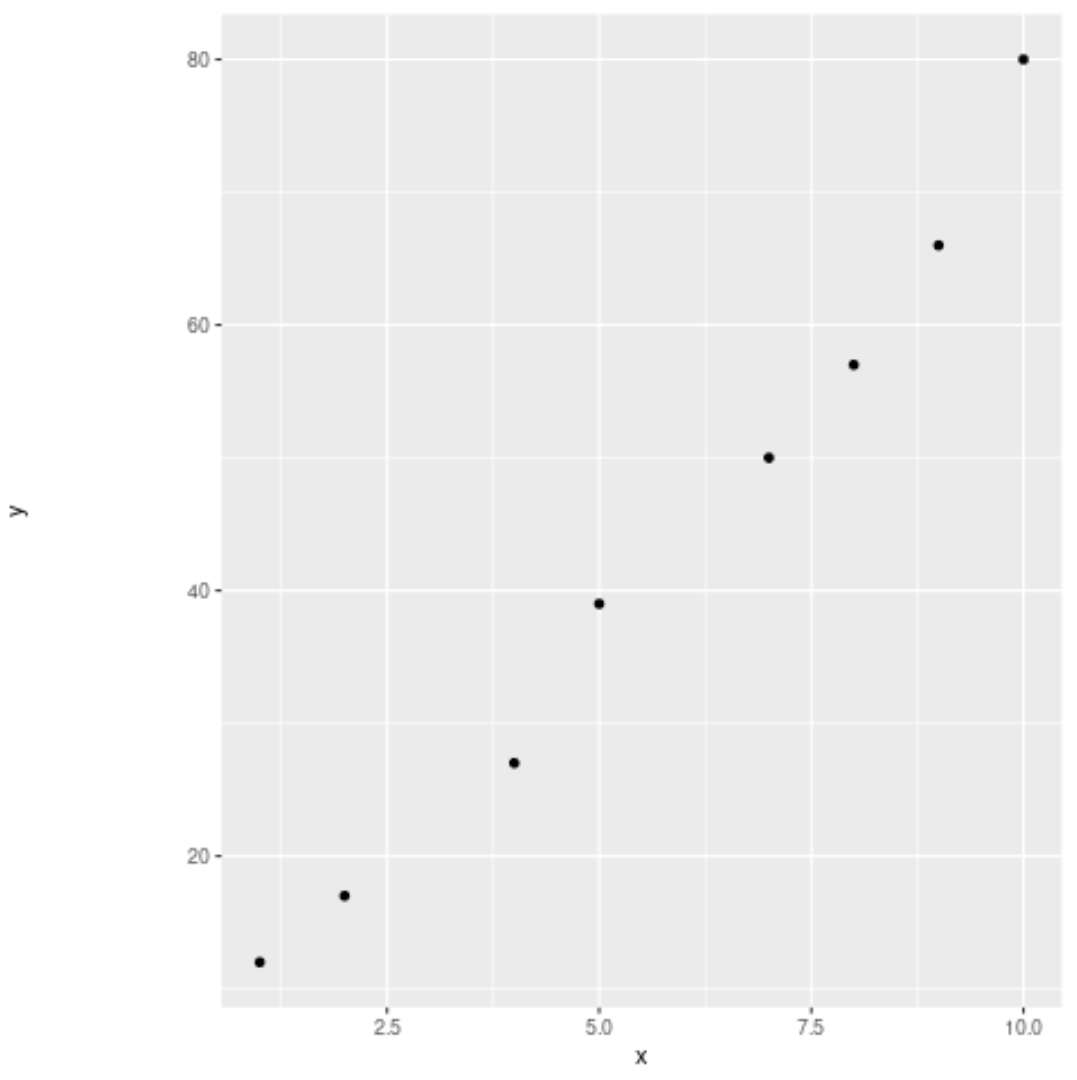
次のコードを使用して、y 軸のタイトルの右側にマージンを追加し、y 軸のタイトルが軸から遠くに表示されるようにすることができます。
 #create scatterplot of x vs. y with margin added on y-axis title
ggplot(df, aes(x=x, y=y)) +
  geom_point() +
  theme(axis. title . y = element_text(margin = margin(r = 70 )))

Y 軸のタイトルと Y 軸の間に大幅なスペースを追加したことに注意してください。
追加リソース
次のチュートリアルでは、ggplot2 でその他の一般的に使用される操作を実行する方法を説明します。
ggplot2 で軸ラベルを回転する方法
ggplot2で軸ブレークを設定する方法
ggplot2 で軸の制限を設定する方法
ggplot2で凡例ラベルを変更する方法