Ggplot2 でマージンを変更する方法 (例あり)
ggplot2 のtheme()引数を使用して、プロットのマージン領域を変更できます。
 ggplot(df, aes(x=x)) +
  geom_histogram() +
  theme(plot. margin =unit(c(5,1,1,1), ' cm '))
プロット余白の順序は次のとおりであることに注意してください。
- 単位(c(上、右、下、左)、単位)
次の例は、実際に ggplot2 プロットのマージン領域を変更する方法を示しています。
例 1: 基本的なプロットを作成する
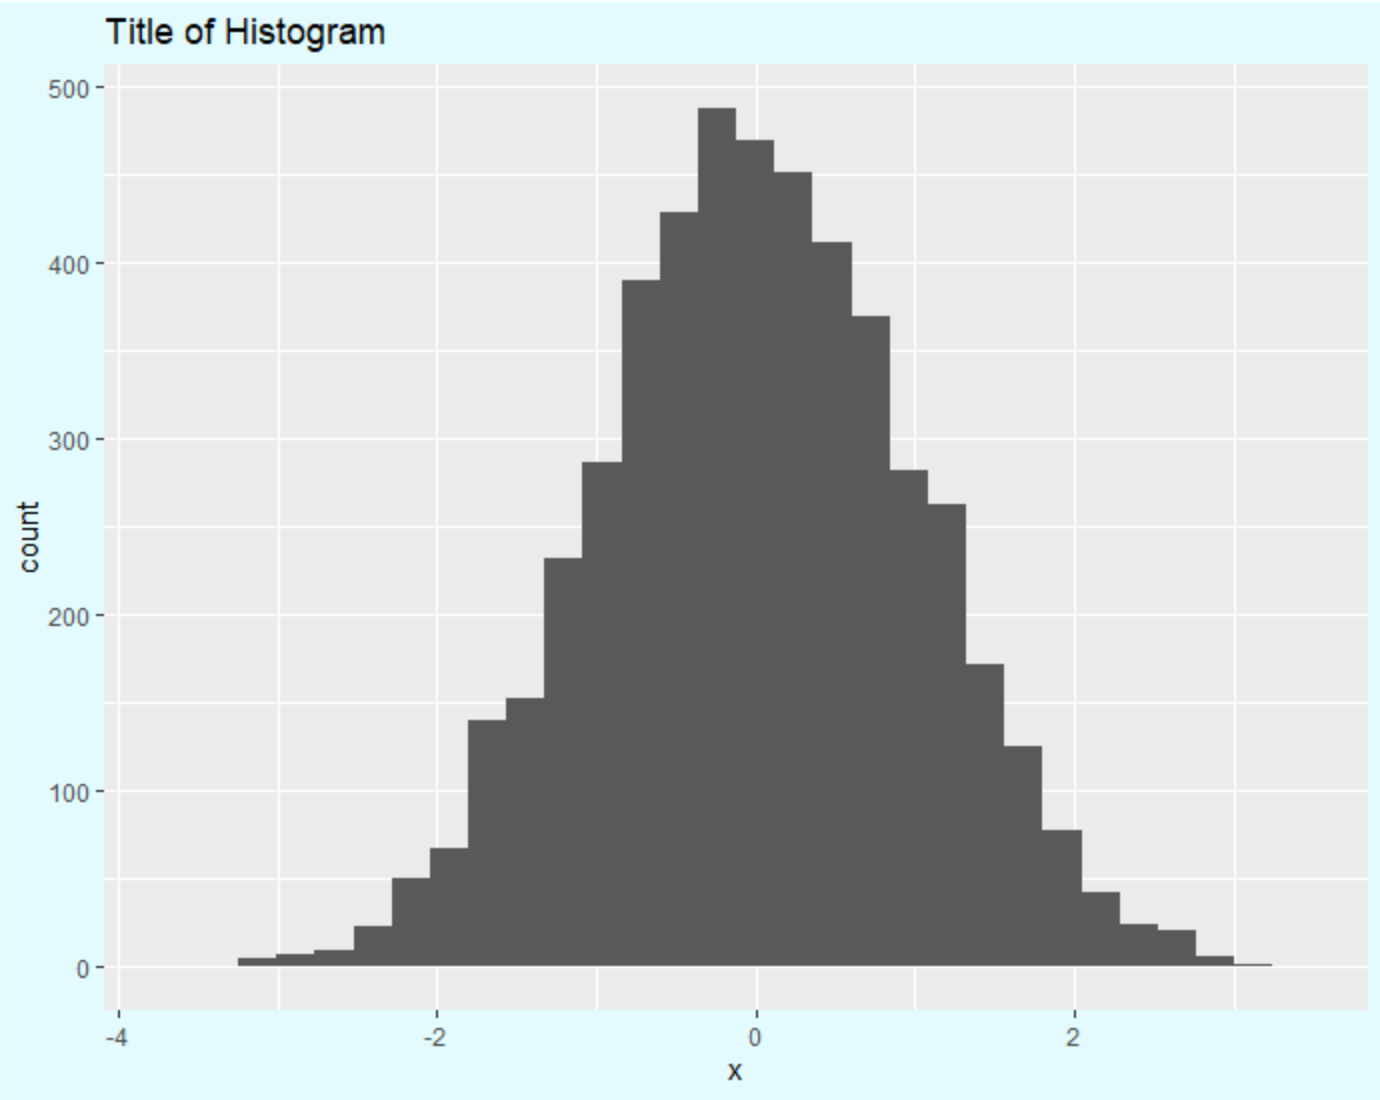
次のコードは、マージン領域を指定せずに ggplot2 で基本的なプロットを作成する方法を示しています。
 library (ggplot2)

#make this example reproducible
set. seeds (0)

#create data
df <- data. frame (x=rnorm(n= 5000 ))

#create histogram using ggplot2
ggplot(df, aes(x=x)) +
  geom_histogram() +
  ggtitle(' Title of Histogram ') +
  theme(plot. background =element_rect(fill=' #e3fbff '))

プロットの両側に最小限のマージンがあることに注意してください。
例 2: プロットの余白を変更する
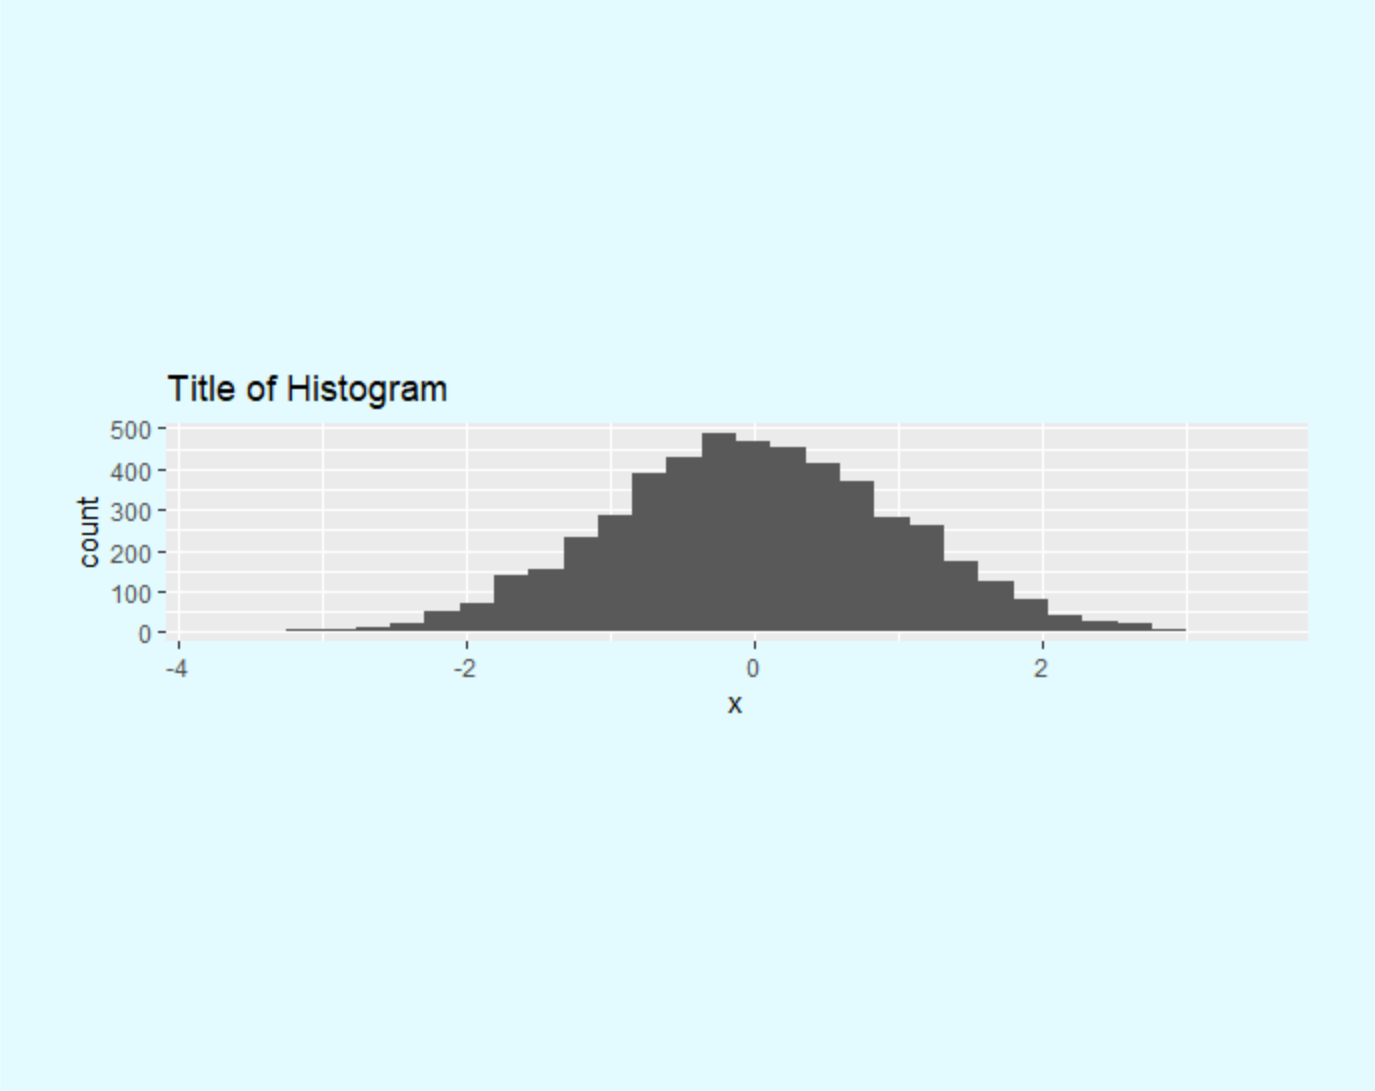
次のコードは、プロットの上部と下部に大幅なマージンを追加する方法を示しています。
 library (ggplot2)

#make this example reproducible
set. seeds (0)

#create data
df <- data. frame (x=rnorm(n= 5000 ))

#create histogram with significant margins on top and bottom
ggplot(df, aes(x=x)) +
  geom_histogram() +
  ggtitle(' Title of Histogram ') +
  theme(plot. margin =unit(c(5,1,5,1), ' cm '),
        plot. background =element_rect(fill=' #e3fbff '))

プロットの上部と下部にかなりの量のスペースがあることに注意してください。
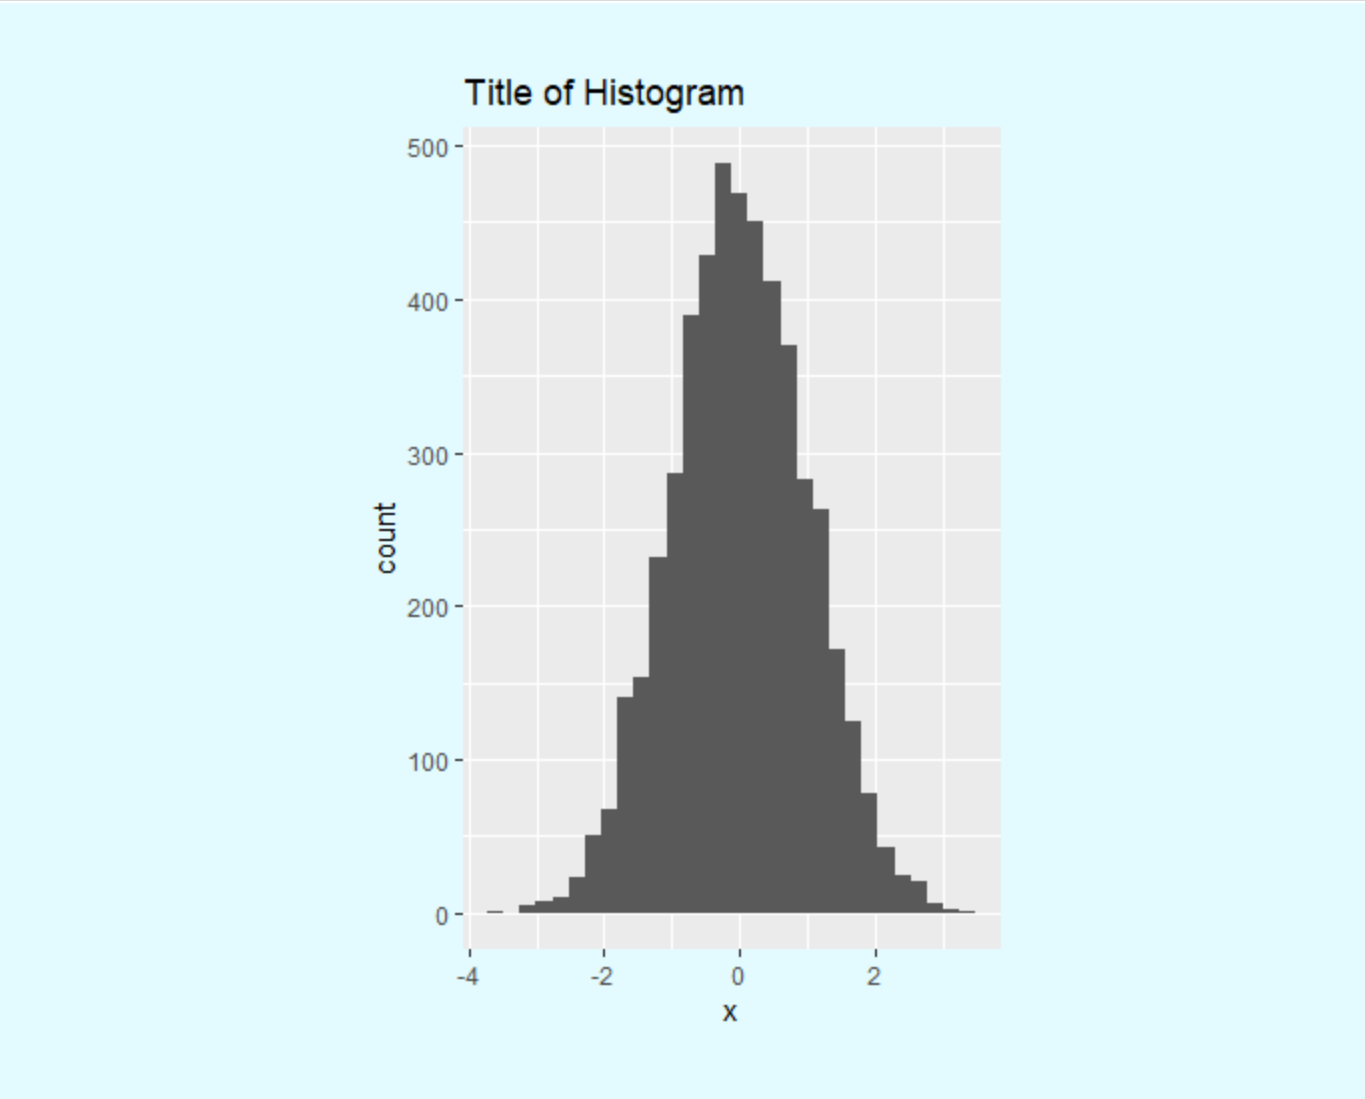
次のコードは、プロットの左右に大幅なマージンを追加する方法を示しています。
 library (ggplot2)

#make this example reproducible
set. seeds (0)

#create data
df <- data. frame (x=rnorm(n= 5000 ))

#create histogram with significant margins on left and right
ggplot(df, aes(x=x)) +
  geom_histogram() +
  ggtitle(' Title of Histogram ') +
  theme(plot. margin =unit(c(1,5,1,5), ' cm '),
        plot. background =element_rect(fill=' #e3fbff '))

プロットの左右に多くのスペースがあることに注意してください。
追加リソース
次のチュートリアルでは、ggplot2 で他の一般的な操作を実行する方法を説明します。
ggplot2でフォントサイズを変更する方法
ggplot2 で軸ラベルを回転する方法
ggplot2で凡例を削除する方法
ggplot2で軸ラベルを削除する方法