Ggplot2でヒストグラムにパーセンテージを表示する方法
次の基本構文を使用して、ggplot2 のヒストグラムの y 軸にパーセンテージを表示できます。
 library (ggplot2)
library (scales)

#create histogram with percentages
ggplot(data, aes (x = factor (team))) +
  geom_bar( aes (y = (..count..)/ sum (..count..))) +
  scale_y_continuous(labels=percent)
次の例は、この構文を実際に使用する方法を示しています。
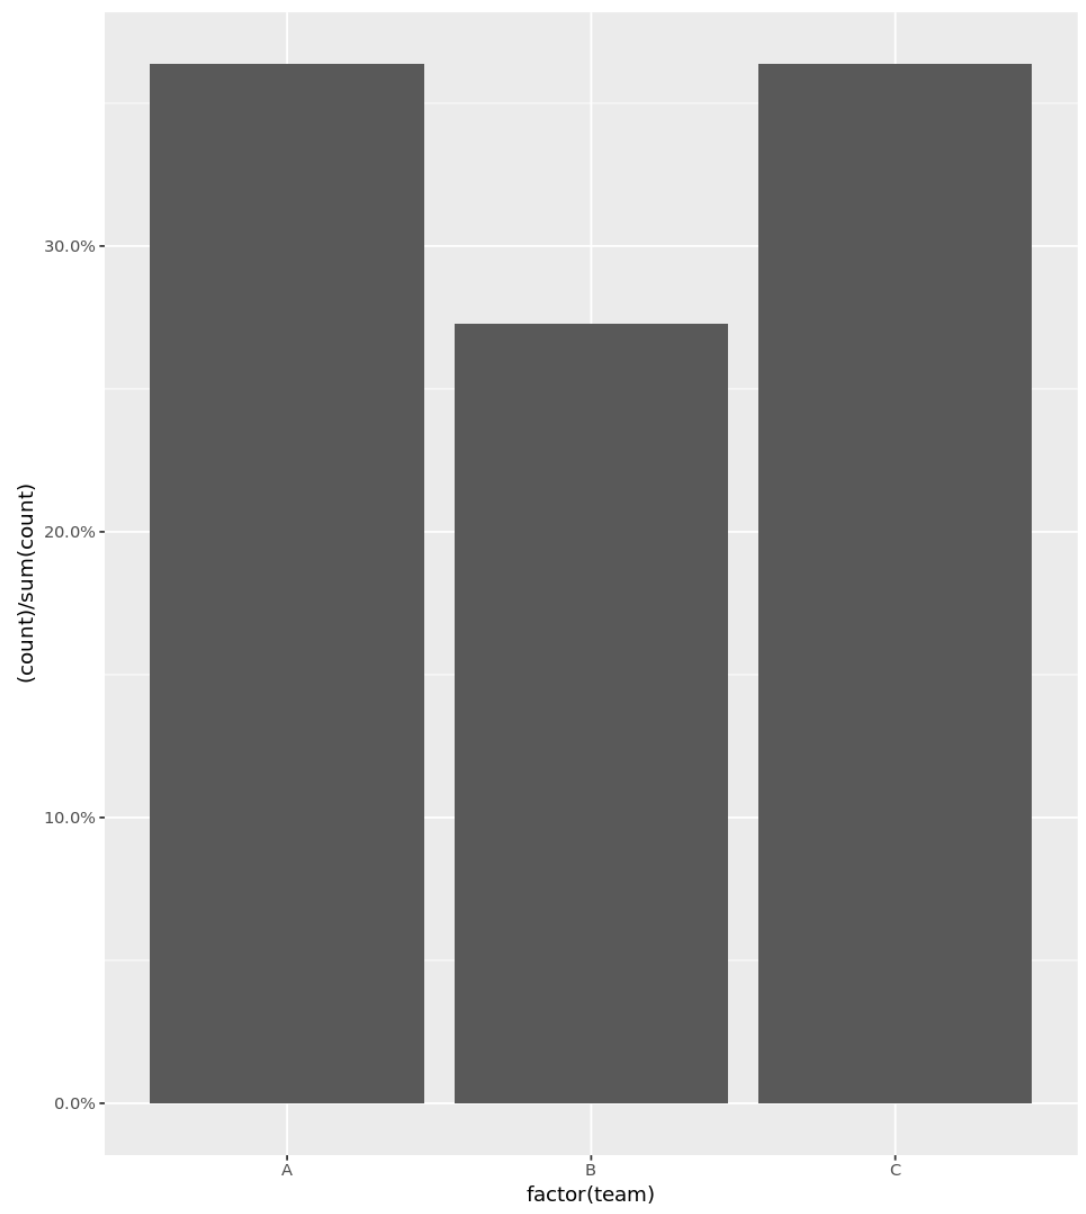
例 1: パーセンテージを含む基本的なヒストグラム
次のコードは、Y 軸にパーセンテージが表示されるカテゴリ変数のヒストグラムを作成する方法を示しています。
 library (ggplot2)
library (scales)

#define data frame
data <- data. frame (team = c('A', 'A', 'A', 'A', 'B', 'B', 'B', 'C', 'C', 'C', 'C') ,
                   points = c(77, 79, 93, 85, 89, 99, 90, 80, 68, 91, 92))

#create histogram with percentages
ggplot(data, aes (x = factor (team))) +
  geom_bar( aes (y = (..count..)/ sum (..count..))) +
  scale_y_continuous(labels=percent)

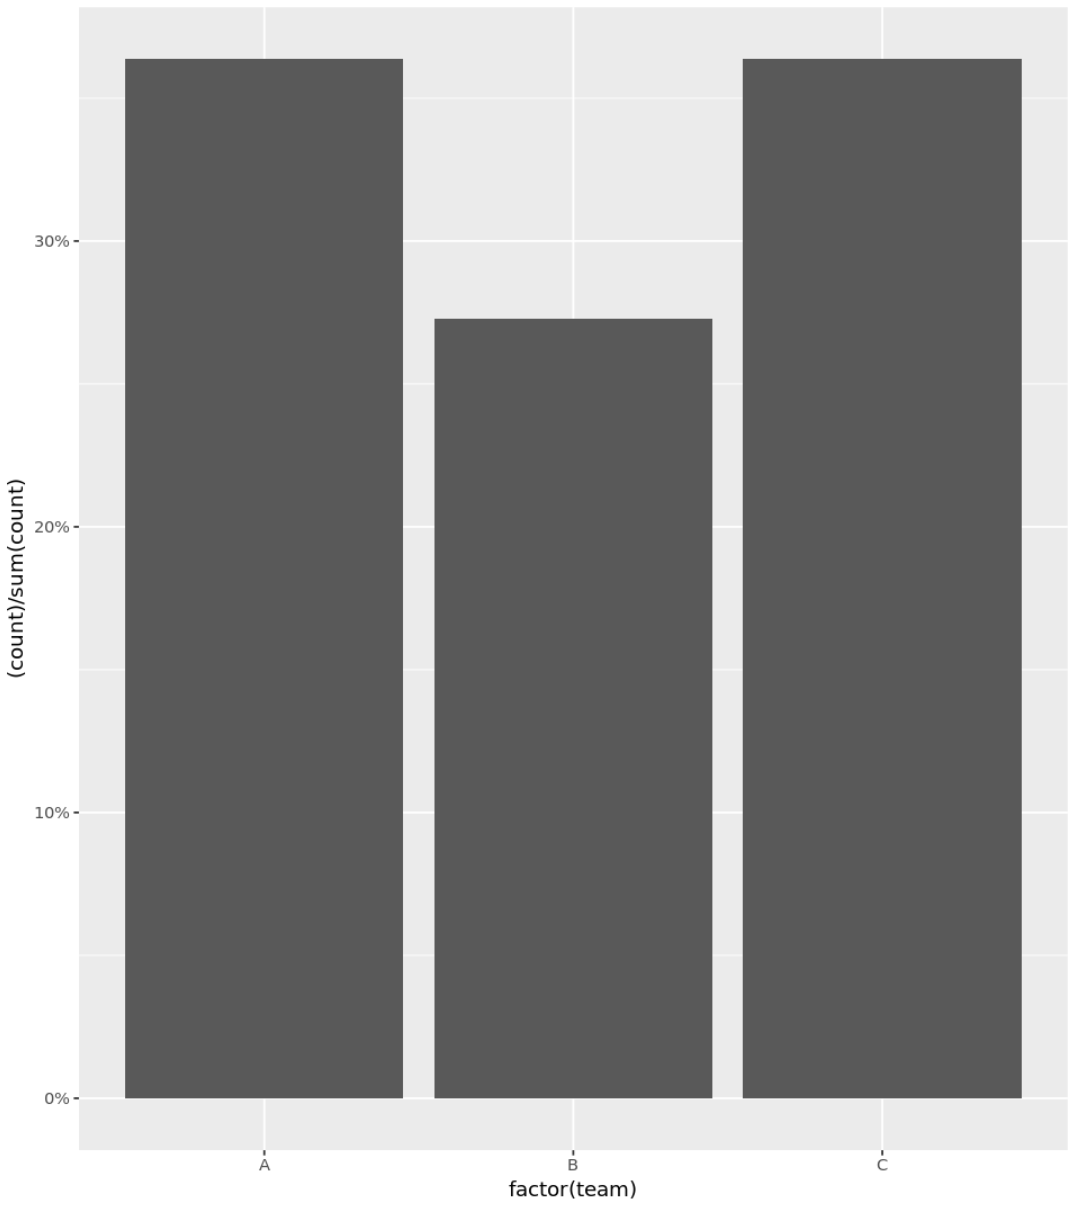
例 2: パーセンテージを含むヒストグラム (小数点を削除)
また、 precision引数を使用して、y 軸に整数のみをパーセンテージとして表示することもできます。
 library (ggplot2)
library (scales)

#define data frame
data <- data. frame (team = c('A', 'A', 'A', 'A', 'B', 'B', 'B', 'C', 'C', 'C', 'C') ,
                   points = c(77, 79, 93, 85, 89, 99, 90, 80, 68, 91, 92))

#create histogram with percentages
ggplot(data, aes (x = factor (team))) +
  geom_bar( aes (y = (..count..)/ sum (..count..))) +
  scale_y_continuous(labels = scales :: percent_format(accuracy = 1L ))

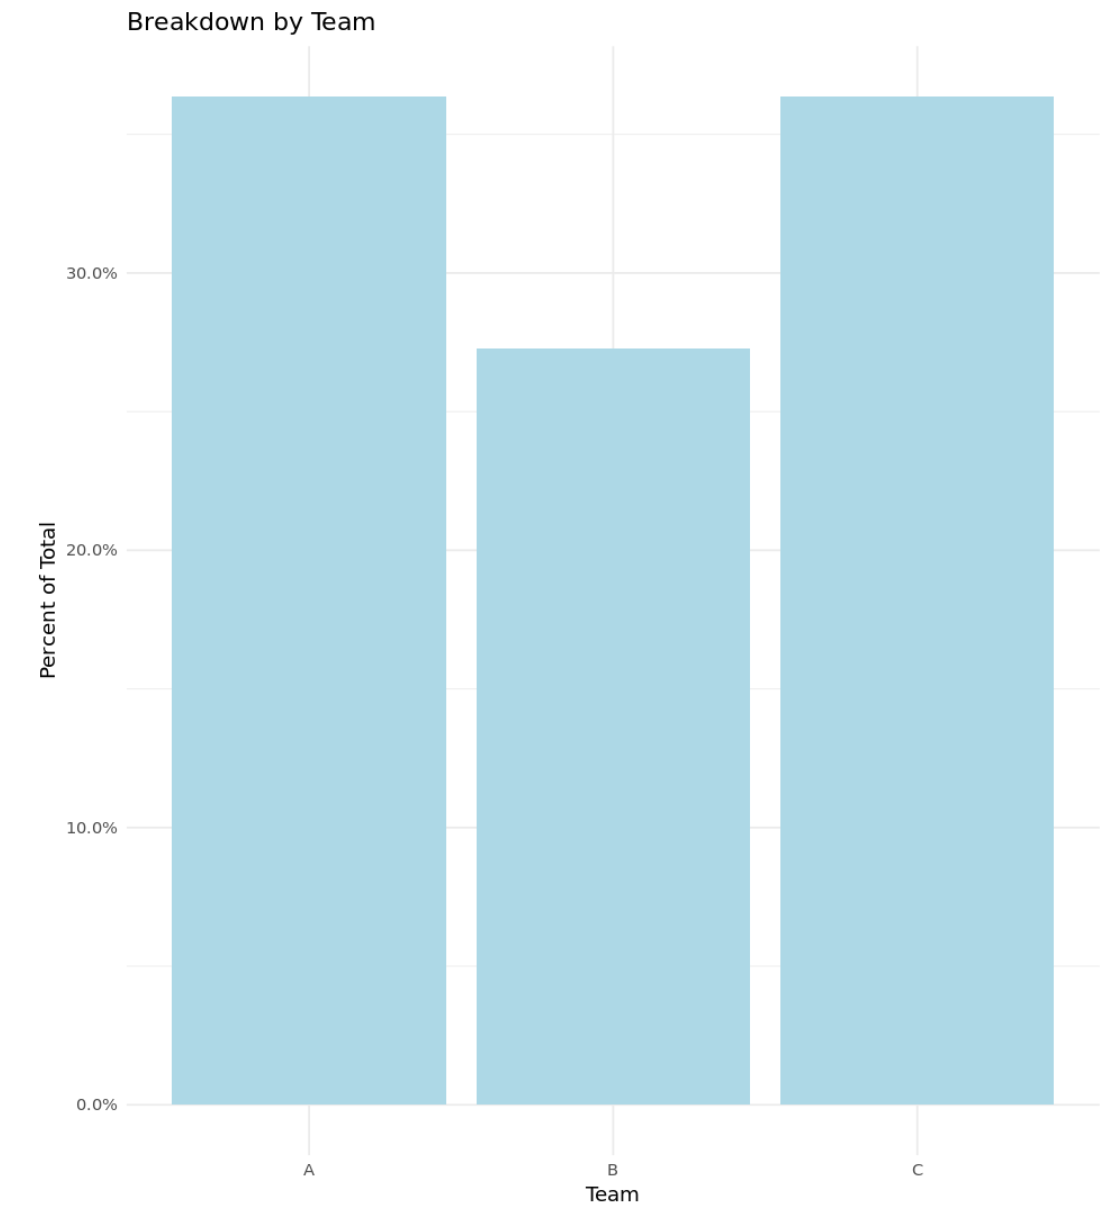
例 3: パーセンテージを含むカスタム ヒストグラム
次のコードは、Y 軸にパーセンテージが表示され、カスタム タイトル、軸ラベル、色が指定されたヒストグラムを作成する方法を示しています。
 library (ggplot2)
library (scales)

#define data frame
data <- data. frame (team = c('A', 'A', 'A', 'A', 'B', 'B', 'B', 'C', 'C', 'C', 'C') ,
                   points = c(77, 79, 93, 85, 89, 99, 90, 80, 68, 91, 92))

#create histogram with percentages and custom aesthetics
ggplot(data, aes (x = factor (team))) +
  geom_bar( aes (y = (..count..)/ sum (..count..)), fill = ' lightblue ') +
  scale_y_continuous(labels=percent) +
  labs(title = ' Breakdown by Team ', x = ' Team ', y = ' Percent of Total ') +
  theme_minimal()

追加リソース
次のチュートリアルでは、R でヒストグラムを使用して他の一般的な操作を行う方法について説明します。
Rでヒストグラムのビン数を変更する方法
R で複数のヒストグラムをプロットする方法
R で相対頻度ヒストグラムを作成する方法