Ggplot2 で手動凡例を作成する方法 (例あり)
カスタムの色、ラベル、タイトルなどを使用して、ggplot2 のプロットに手動の凡例を追加したい場合がよくあります。
幸いなことに、これは、 scale_color_manual()関数を使用して簡単に実行でき、次の例はその方法を示しています。
例: ggplot2 での手動凡例の作成
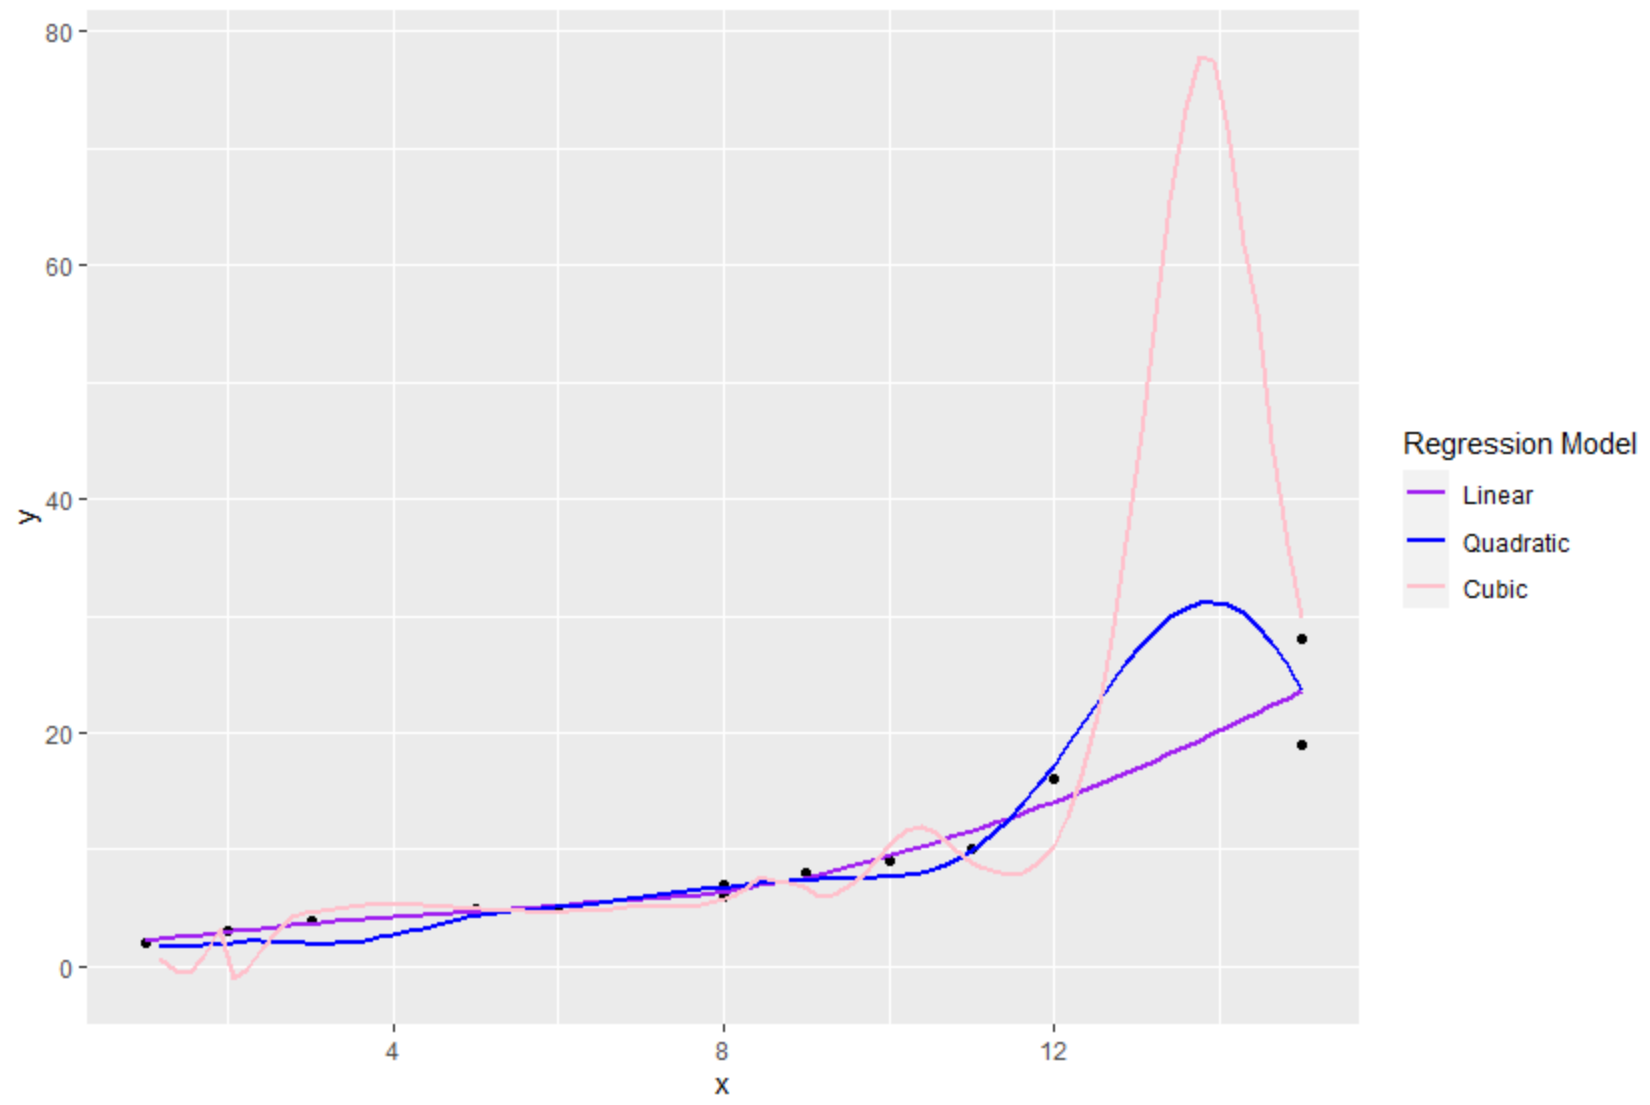
次のコードは、カスタムの手動凡例を使用して、ggplot2 のプロットに 3 つの近似回帰直線をプロットする方法を示しています。
 library (ggplot2)

#create data frame
df <- data. frame (x=c(1, 2, 2, 3, 5, 6, 8, 8, 9, 9, 10, 11, 12, 15, 15),
                 y=c(2, 3, 3, 4, 5, 5, 6, 7, 8, 8, 9, 10, 16, 19, 28))

#create plot with three fitted regression models
ggplot(df, aes(x, y)) +
  geom_point() +
  geom_smooth(se= FALSE , aes(color=' Linear ')) +
  geom_smooth(formula=y~poly(x, 2), se= FALSE , aes(color=' Quadratic ')) +
  geom_smooth(formula=y~poly(x, 3), se= FALSE , aes(color=' Cubic ')) +
  scale_color_manual(name=' Regression Model ',
                     breaks=c(' Linear ', ' Quadratic ', ' Cubic '),
                     values=c(' Cubic '=' pink ', ' Quadratic '=' blue ', ' Linear '=' purple '))

scale_color_manual()関数を使用すると、凡例の次の側面を指定できました。
- name : レジェンドのタイトル
- Breaks : 凡例内のラベル
- 値: 凡例の色
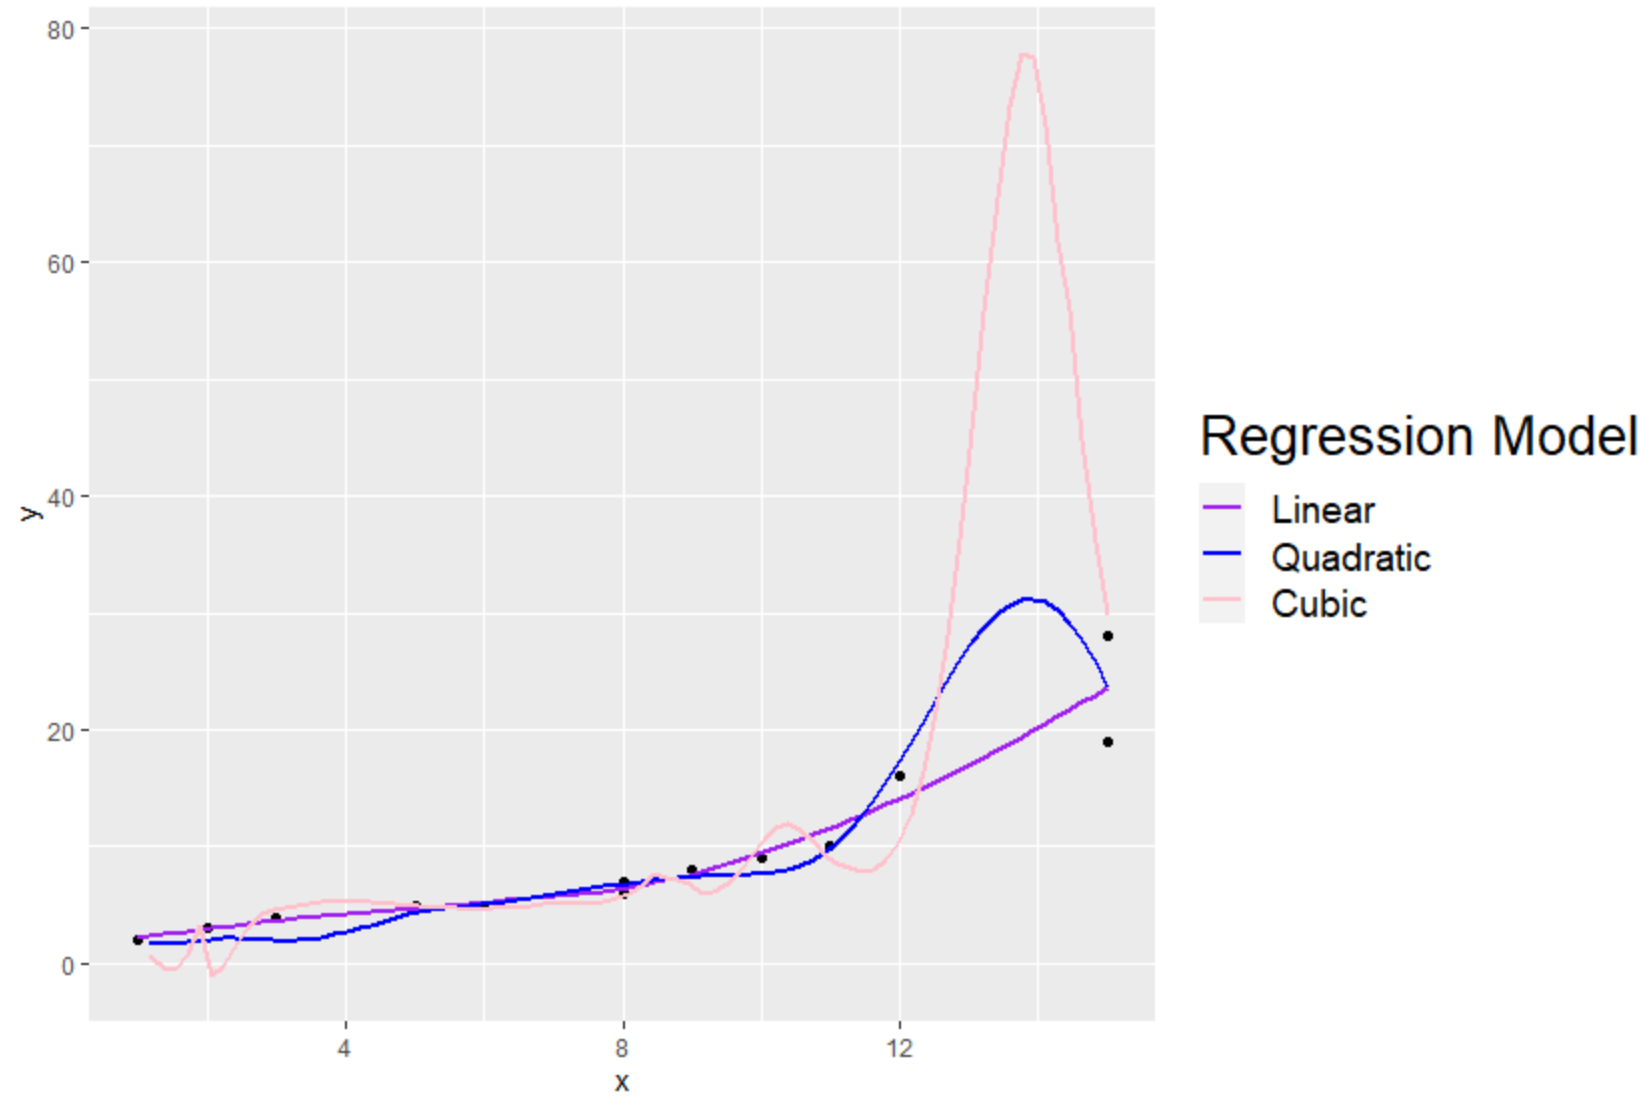
theme()関数を使用して凡例要素のフォント サイズを変更することもできることに注意してください。
 library (ggplot2)

#create data frame
df <- data. frame (x=c(1, 2, 2, 3, 5, 6, 8, 8, 9, 9, 10, 11, 12, 15, 15),
                 y=c(2, 3, 3, 4, 5, 5, 6, 7, 8, 8, 9, 10, 16, 19, 28))

#create plot with three fitted regression models
ggplot(df, aes(x, y)) +
  geom_point() +
  geom_smooth(se= FALSE , aes(color=' Linear ')) +
  geom_smooth(formula=y~poly(x, 2), se= FALSE , aes(color=' Quadratic ')) +
  geom_smooth(formula=y~poly(x, 3), se= FALSE , aes(color=' Cubic ')) +
  scale_color_manual(name=' Regression Model ',
                     breaks=c(' Linear ', ' Quadratic ', ' Cubic '),
                     values=c(' Cubic '=' pink ', ' Quadratic '=' blue ', ' Linear '=' purple '))+
 theme(legend. title =element_text(size= 20 ),
       legend. text =element_text(size= 14 ))

タイトルとキャプションのラベルのフォント サイズが大きくなっていることに注意してください。
追加リソース
次のチュートリアルでは、ggplot2 で他の一般的な操作を実行する方法を説明します。
ggplot2で凡例の位置を変更する方法
ggplot2で凡例のサイズを変更する方法
ggplot2で凡例のタイトルを変更する方法
ggplot2で凡例ラベルを変更する方法