Ggplot2 のヒストグラムにラベルを追加する方法 (例あり)
次の基本構文を使用して、ggplot2 のヒストグラムにラベルを追加できます。
 ggplot(data=df, aes(x=values_var)) +
  geom_histogram(aes(fill=group_var), binwidth= 1 , color=' black ') +
  stat_bin(binwidth= 1 , geom=' text ', color=' white ', size= 4 ,
           aes(label=..count.., group=group_var), position=position_stack(vjust= 0.5 ))
この特定の例では、白いラベルを追加して、ヒストグラムの各カテゴリの各ビンの数を表示します。
次の例は、この構文を実際に使用する方法を示しています。
例: ggplot2 のヒストグラムにラベルを追加する
R に、3 つの異なるチームのバスケットボール選手が獲得したポイントに関する情報を含む次のデータ フレームがあるとします。
 #make this example reproducible
set. seeds (1)

#create data frame
df <- data. frame (team=rep(c(' A ', ' B ', ' C '), each=100),
                 points=c(runif(100, 5, 10),
                          runif(100, 5, 10),
                          runif(100, 5, 10)))

#view head of data frame
head(df)

  team points
1 A 6.327543
2 A 6.860619
3 A 7.864267
4 A 9.541039
5 A 6.008410
6 A 9.491948
次のコードを使用して、各ビンの合計を示すラベルを付けて、各チームのプレーヤーが獲得したポイントを示すヒストグラムを作成できます。
 library (ggplot2)

#create histogram with labels for each bin
ggplot(data=df, aes(x=points)) +
  geom_histogram(aes(fill=team), binwidth= 1 , color=' black ') +
  stat_bin(binwidth= 1 , geom=' text ', color=' white ', size= 4 ,
           aes(label=..count.., group=team), position=position_stack(vjust= 0.5 ))
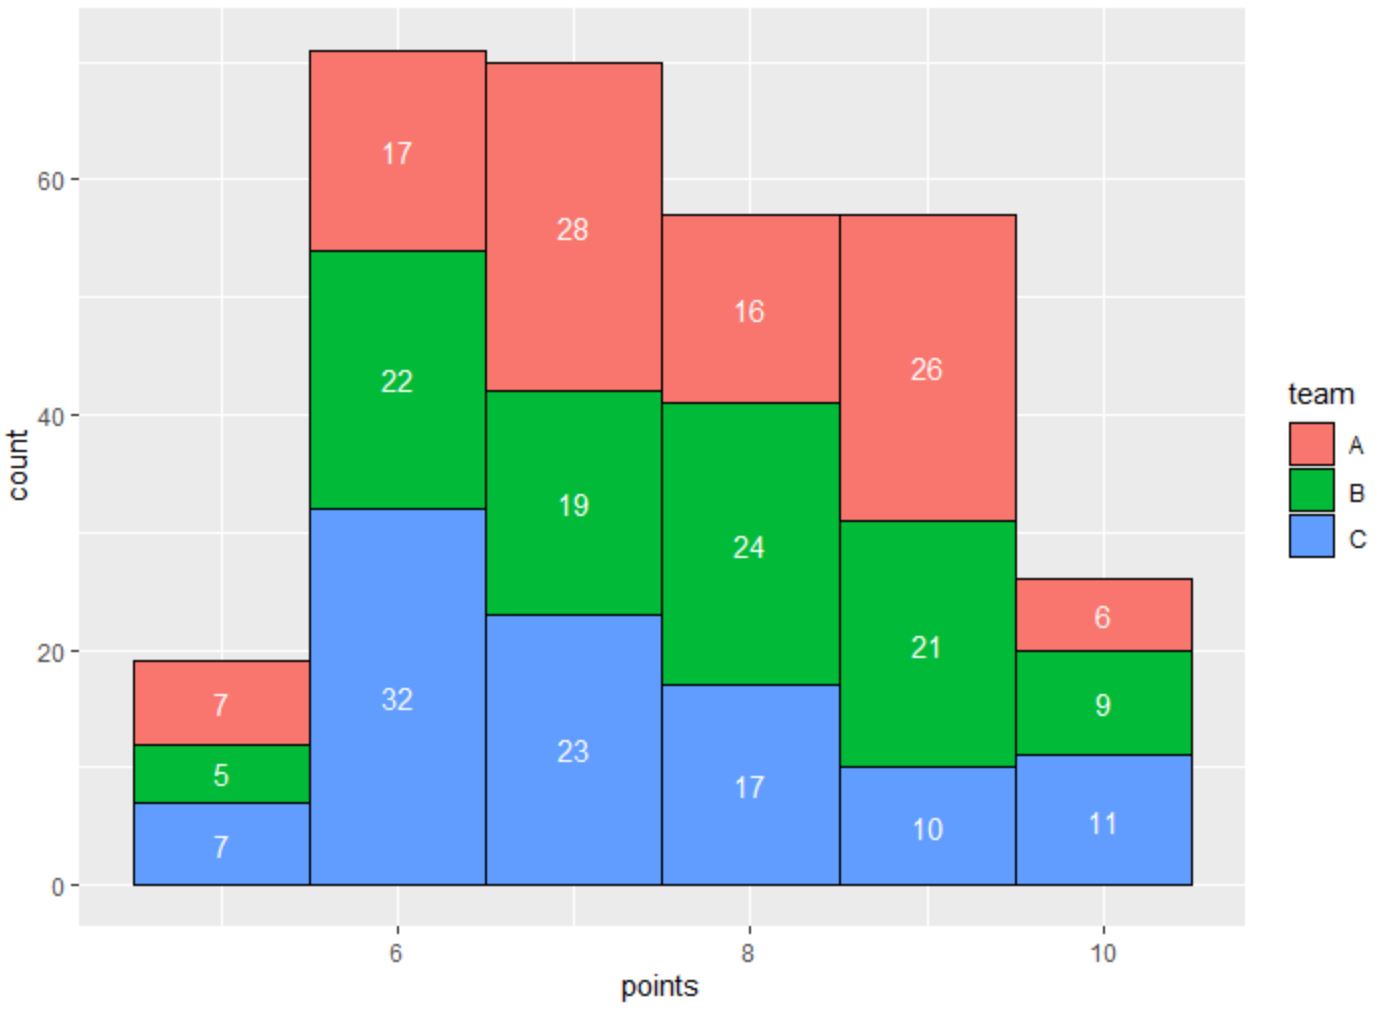
各ビンには、各ビンの番号を表示するラベルが付いていることに注意してください。
stat_bin()関数で色とサイズの値を変更すると、それぞれラベルの色とサイズを変更できることに注意してください。
たとえば、次の構文を使用して、代わりにフォント サイズを大きくした黒いラベルを使用できます。
 library (ggplot2)

#create histogram with labels for each bin
ggplot(data=df, aes(x=points)) +
  geom_histogram(aes(fill=team), binwidth= 1 , color=' black ') +
  stat_bin(binwidth= 1 , geom=' text ', color=' black ', size= 6 ,
           aes(label=..count.., group=team), position=position_stack(vjust= 0.5 ))
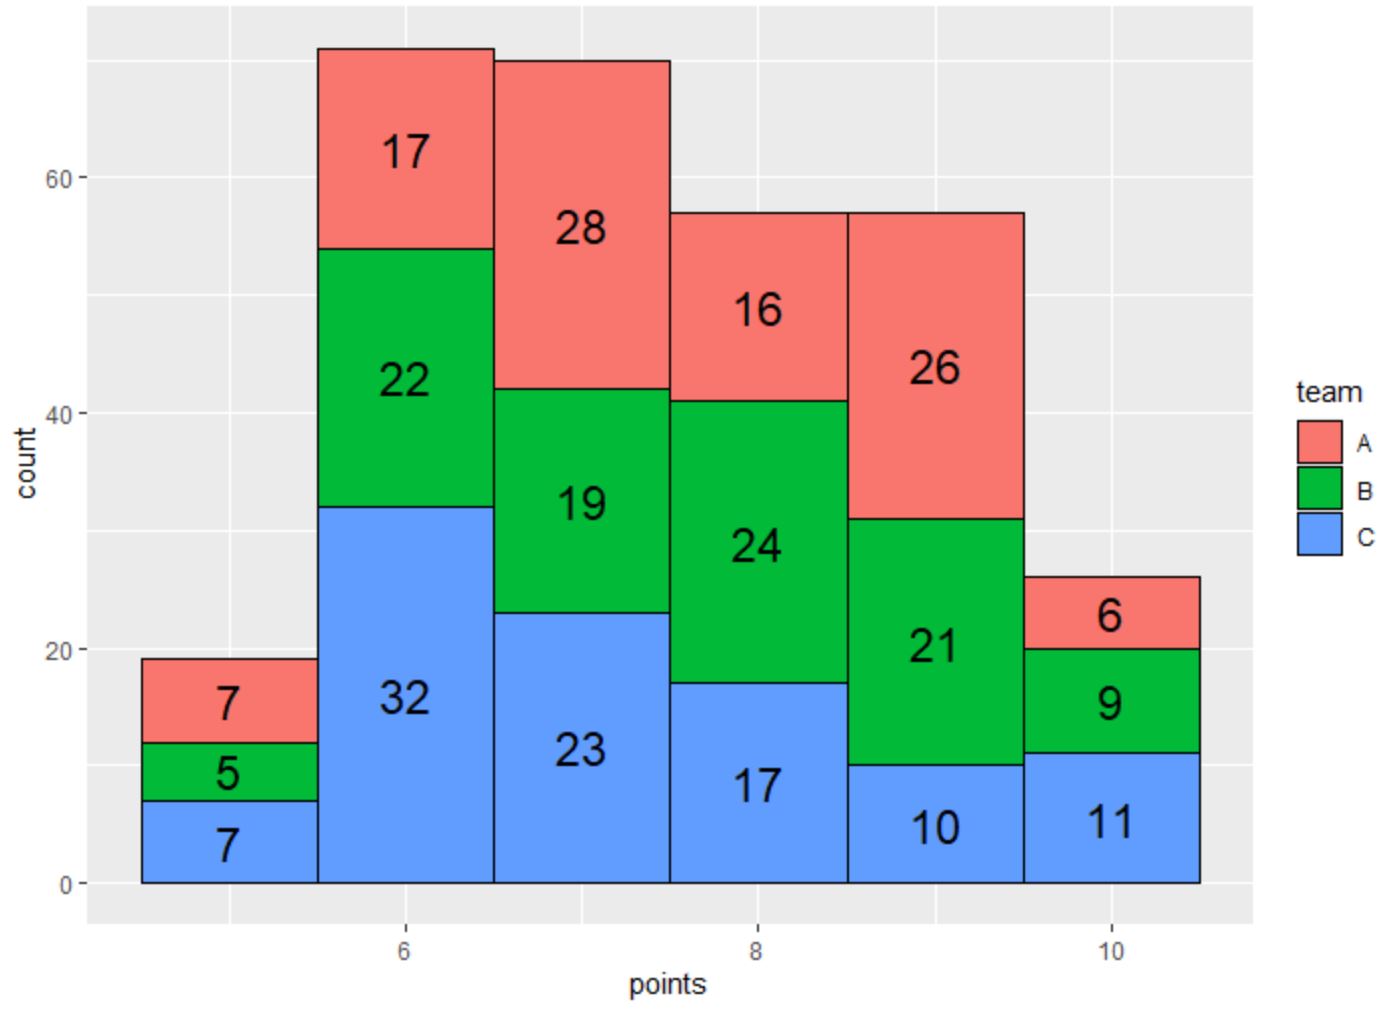
各ビンのラベルには黒いテキストと大きなフォント サイズが使用されるようになりました。
stat_bin()関数の色とサイズの引数を自由にいじって、ラベルを希望どおりに表示してください。
追加リソース
次のチュートリアルでは、R で他の一般的なタスクを実行する方法について説明します。
ggplot2でグループごとにヒストグラムを作成する方法
ggplot2でヒストグラムにパーセンテージを表示する方法
ggplot2 でヒストグラムのビンの数を設定する方法
著者について
ベンジャミン・アンダーソン博士
私はベンジャミンです。退職した統計教授から、専任の Statorials 教育者になりました。 統計分野における豊富な経験と専門知識を活かして、私は Statorials を通じて学生に力を与えるために自分の知識を共有することに尽力しています。もっと知る