Ggplot2 で凡例を削除する方法 (例付き)
次の構文を使用して、ggplot2 のプロットから凡例を削除できます。
 ggplot(df, aes (x=x, y=y, color=z)) +
  geom_point() +
  theme( legend.position =" none ")
legend.position=”none”を指定すると、プロットからすべての凡例を削除するように ggplot2 に指示します。
次の段階的な例は、この構文を実際に使用する方法を示しています。
ステップ 1: データフレームを作成する
まず、データ フレームを作成しましょう。
 #create data frame
df <- data. frame (assists=c(3, 4, 4, 3, 1, 5, 6, 7, 9),
                 points=c(14, 8, 8, 16, 3, 7, 17, 22, 26),
                 position=rep(c('Guard', 'Forward', 'Center'), times= 3 ))

#view data frame
df

  assist points position
1 3 14 Guard
2 4 8 Forward
3 4 8 Center
4 3 16 Guard
5 1 3 Forward
6 5 7 Center
7 6 17 Guard
8 7 22 Forward
9 9 26 Center
ステップ 2: ggplot2 を使用してプロットを作成する
次に、ggplot2 を使用して単純な散布図を作成しましょう。
 library (ggplot2)

#create scatterplot
ggplot(df, aes (x=assists, y=points, color=position)) +
  geom_point(size= 3 )
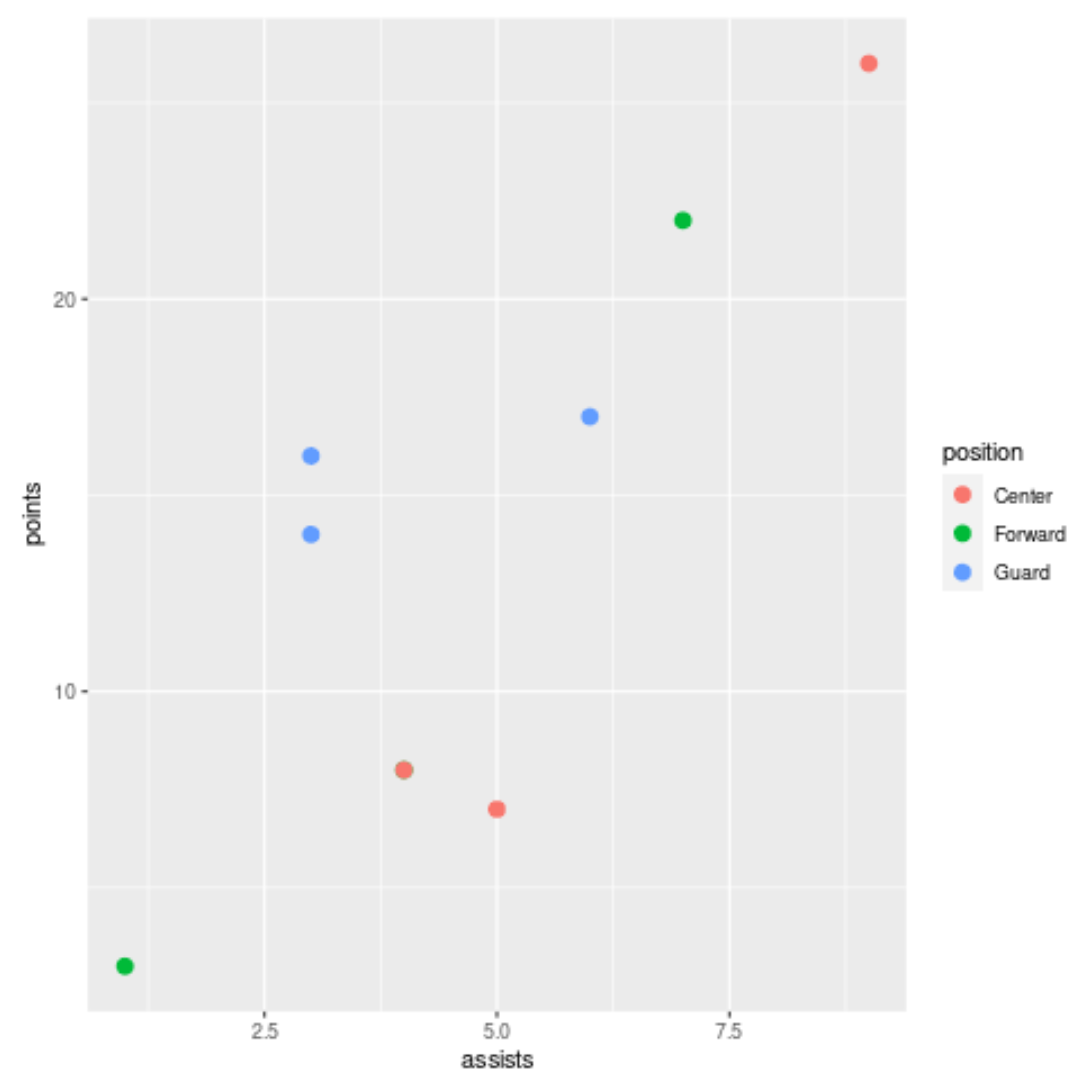
デフォルトでは、ggplot2 には散布図の色の解釈を容易にする凡例が含まれています。
ステップ 3: プロット凡例を削除する
次に、 legend.position=”none”を使用してプロットから凡例を削除しましょう。
 library (ggplot2)

#create scatterplot with no legend
ggplot(df, aes (x=assists, y=points, color=position)) +
  geom_point(size= 3 ) +
  theme( legend.position =" none ")
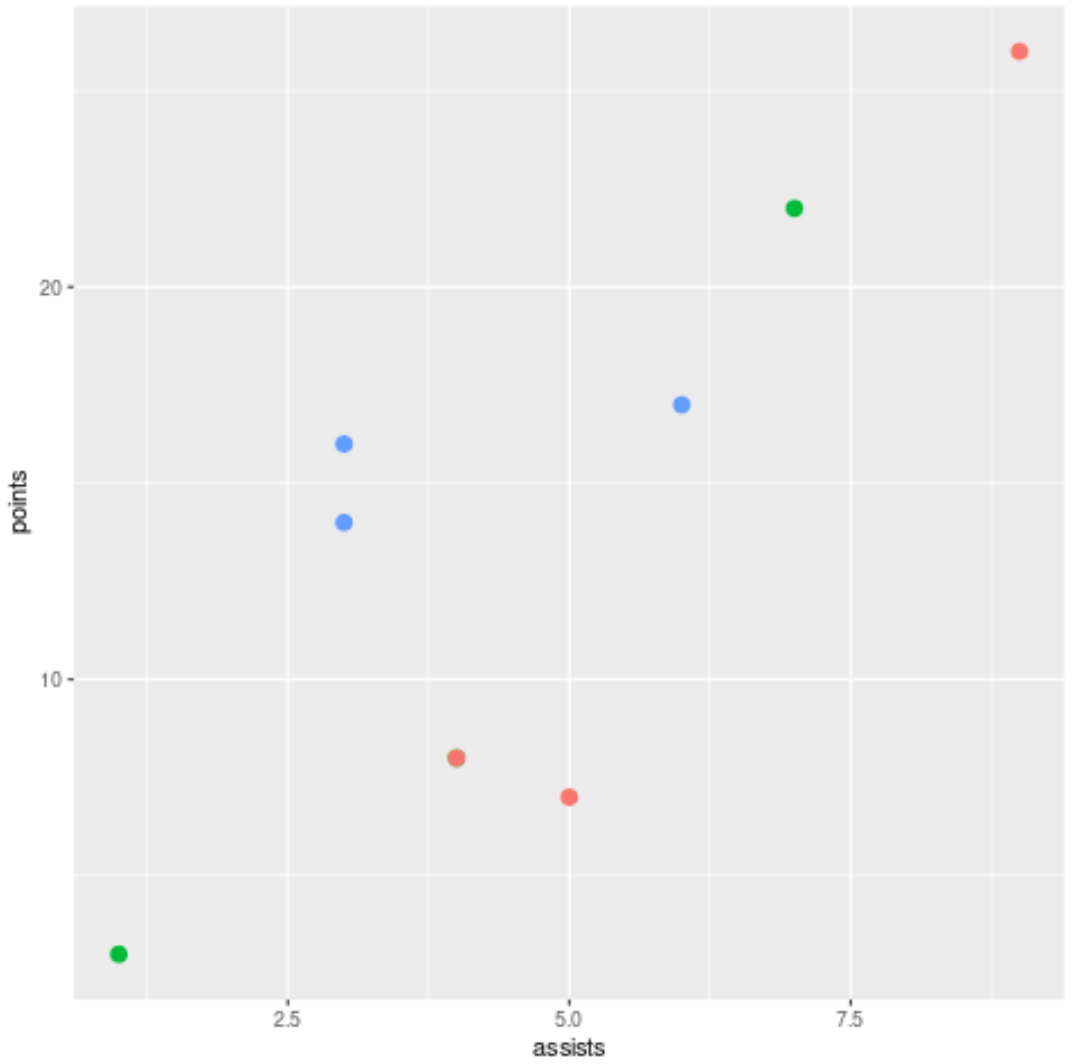
伝説はプロットから完全に削除されました。
追加リソース
次のチュートリアルでは、ggplot2 で他の一般的な操作を実行する方法を説明します。
ggplot2で凡例のタイトルを変更する方法
ggplot2で凡例のサイズを変更する方法
ggplot2で凡例の位置を変更する方法
著者について
ベンジャミン・アンダーソン博士
私はベンジャミンです。退職した統計教授から、専任の Statorials 教育者になりました。 統計分野における豊富な経験と専門知識を活かして、私は Statorials を通じて学生に力を与えるために自分の知識を共有することに尽力しています。もっと知る