Ggplot2 でバー間のスペースを調整する方法 (例あり)
次の方法を使用して、ggplot2 棒グラフの棒間のスペースを調整できます。
方法 1: 棒グラフの棒の間隔を調整する
 ggplot(df, aes(x=x_variable)) +
  geom_bar(width= .4 )
バー間のデフォルトの幅は0.9です。
幅が1に近づくほど、バーは近くなります。幅が0に近づくほど、バーはより多く広がります。
方法 2: グループ化棒グラフの棒間の間隔を調整する
 ggplot(df, aes(x=x_variable, y=y_variable, fill=fill_variable)) +
  geom_bar(width= .5 , stat=' identity ', position=position_dodge( .7 ))
width値はクラスター間の間隔を制御し、 position_dodge()値は同じクラスター内のバー間の間隔を制御します。
次の例は、R の次のデータ フレームで各メソッドを実際に使用する方法を示しています。
 #create data frame
df <- data. frame (team=c('A', 'A', 'A', 'B', 'B', 'B', 'C', 'C'),
                 position=c('G', 'G', 'F', 'G', 'F', 'F', 'F', 'G'),
                 points=c(12, 22, 24, 23, 20, 15, 11, 30))

#view data frame
df

  team position points
1 AG 12
2 AG 22
3 AF 24
4 BG 23
5 BF 20
6 BF 15
7 CF 11
8 CG 30
例 1: 棒グラフの棒間の間隔を調整する
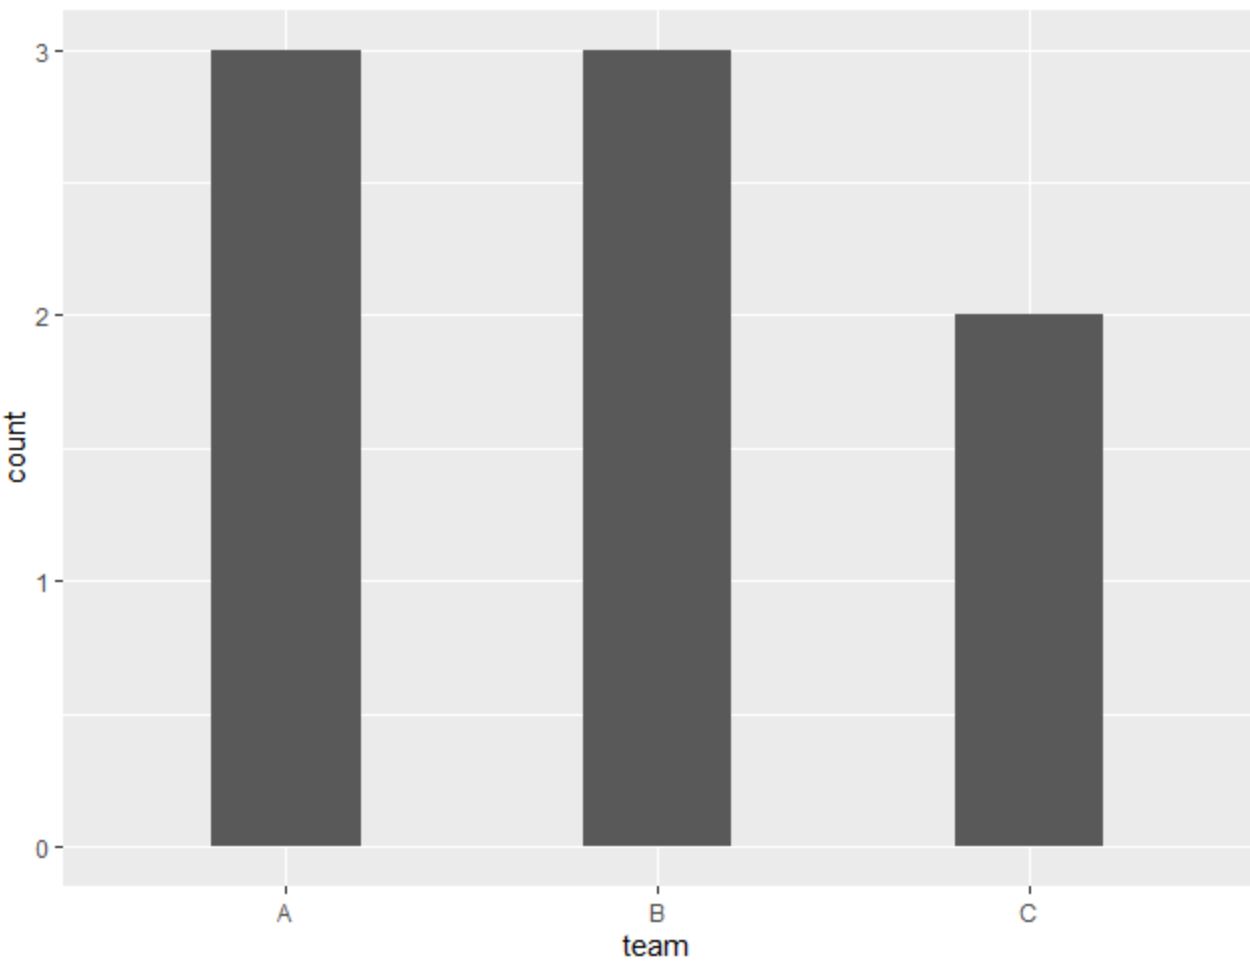
次のコードは、デフォルトの幅間隔0.9を使用して各チームの出現を視覚化する棒グラフを作成する方法を示しています。
 library (ggplot2)

#create bar plot with default spacing
ggplot(df, aes(x=team)) +
  geom_bar()
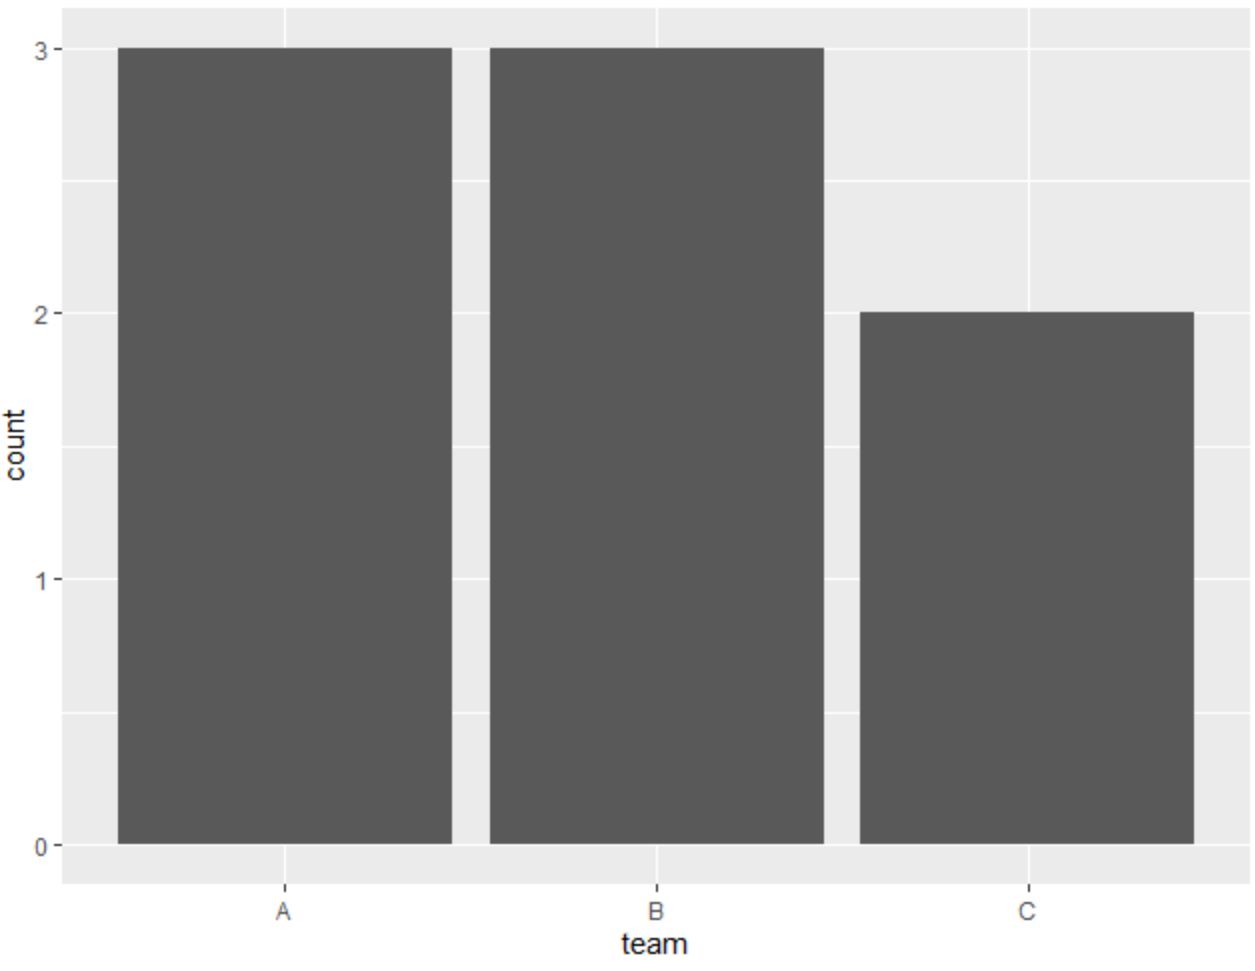
次のコードは、 width引数の値を0.4に減らしてバー間のスペースを増やす方法を示しています。
 library (ggplot2)

#create bar plot with increased spacing
ggplot(df, aes(x=team)) +
  geom_bar(width= .4 )
width引数の値を減らすことで、バー間の間隔が広がりました。
例 2: グループ化された棒グラフの棒間の間隔を調整する
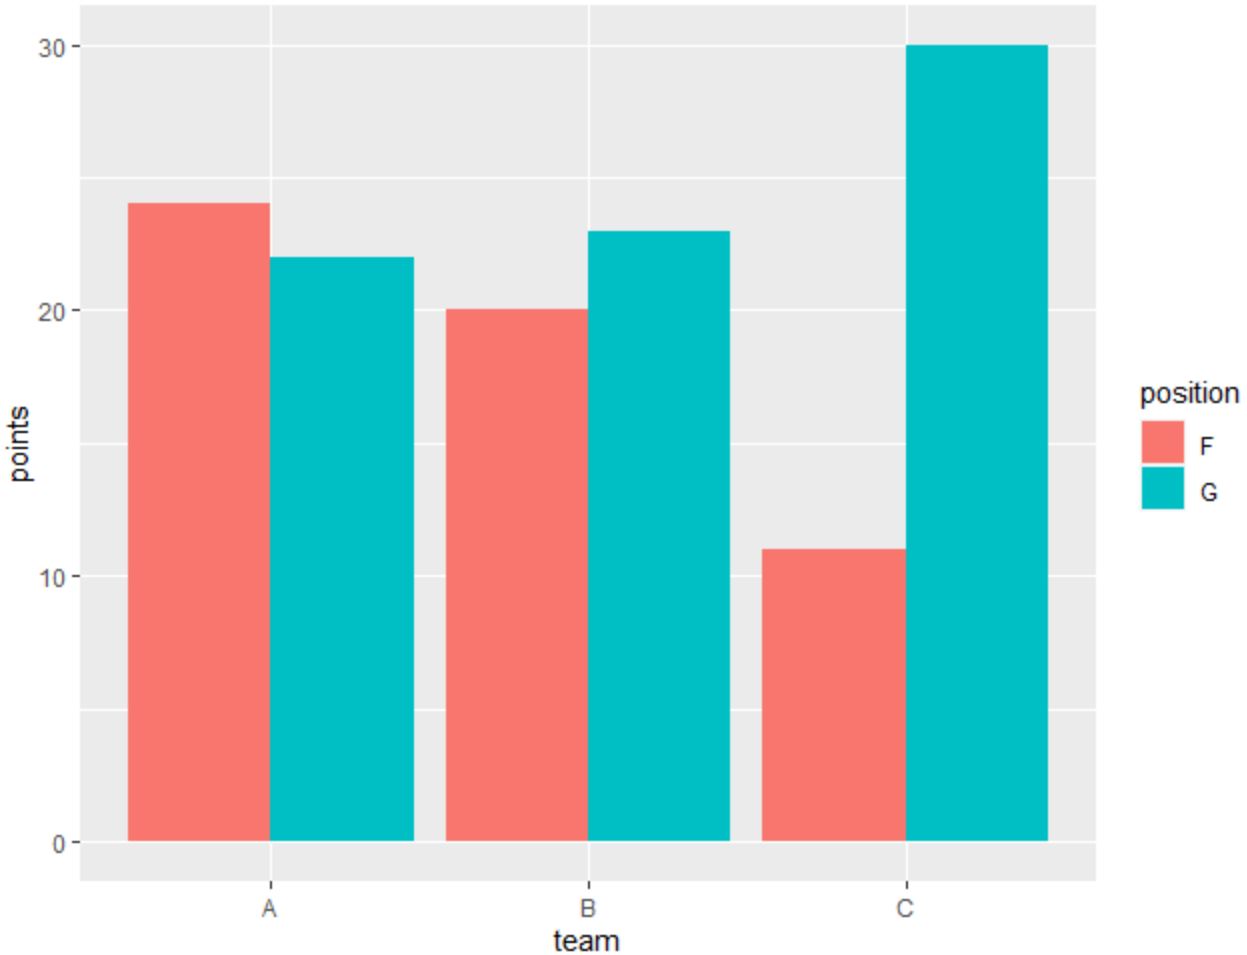
次のコードは、グループ化された棒グラフを作成して、チームおよびポジションごとに獲得した合計ポイントを視覚化する方法を示しています。
 library (ggplot2)

#create clustered bar plot with default spacing
ggplot(df, aes(x=team, y=points, fill=position)) +
  geom_bar(stat=' identity ', position=' dodge ')
次のコードは、クラスター化されたバー間のスペースと、同じクラスター内のバー間のスペースの両方を増やす方法を示しています。
 library (ggplot2)

#create clustered bar plot with increased spacing
ggplot(df, aes(x=team, y=points, fill=position)) +
  geom_bar(width= .5 , stat=' identity ', position=position_dodge( .7 ))
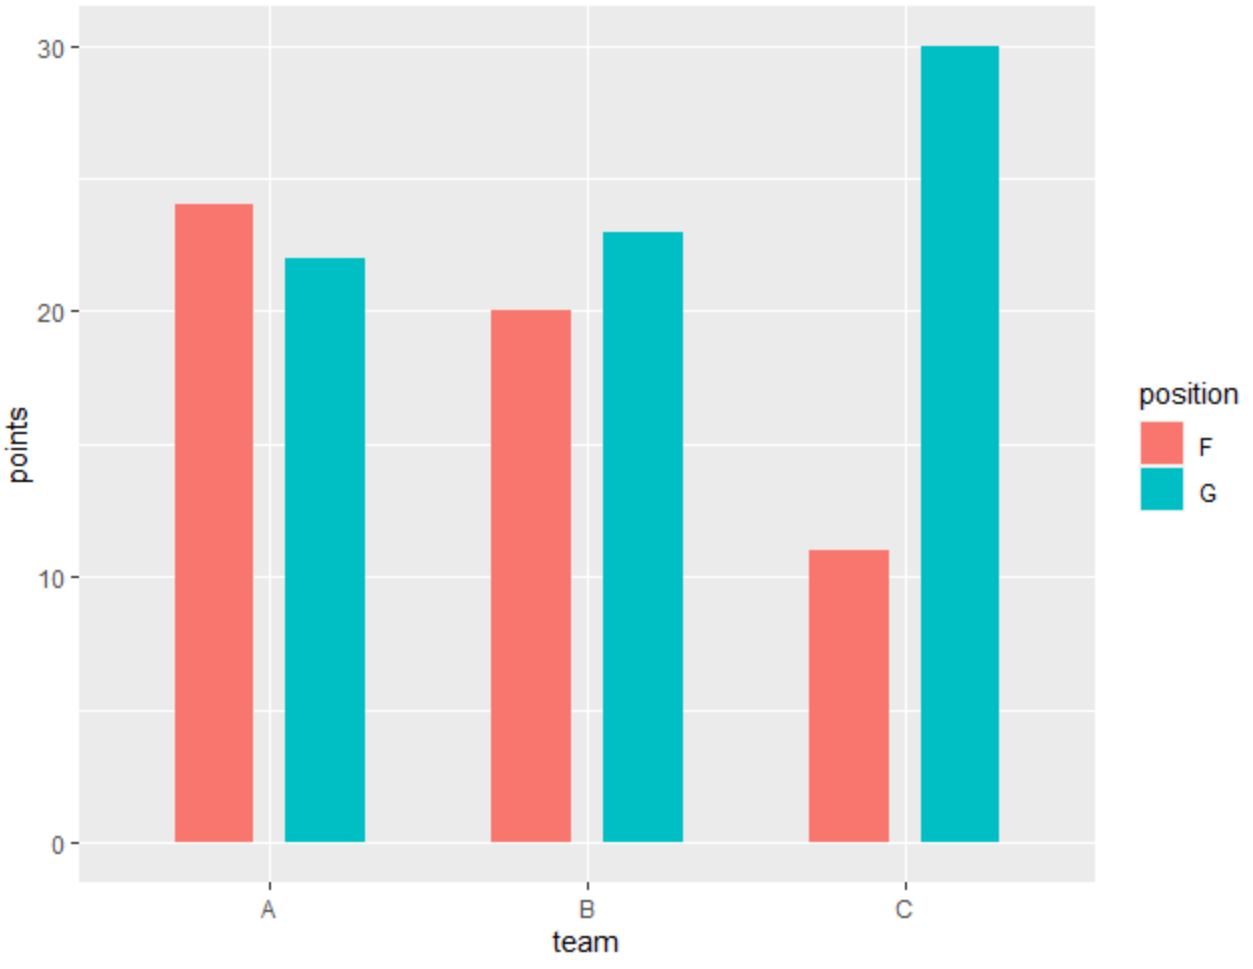
幅の値を小さくすることで、クラスター間の間隔が広がりました。
そして、 position_dodge()の値を減らすことで、同じクラスター内のバー間の間隔を増やしました。
これら 2 つの引数の値を自由に試して、希望通りの棒グラフを表示してください。
追加リソース
次のチュートリアルでは、ggplot2 で他の一般的なタスクを実行する方法を説明します。
ggplot2 棒グラフで棒を並べ替える方法
ggplot2 の積み上げ棒グラフの棒を再配置する方法
ggplot2の積み上げ棒グラフで棒の色を変更する方法
著者について
ベンジャミン・アンダーソン博士
私はベンジャミンです。退職した統計教授から、専任の Statorials 教育者になりました。 統計分野における豊富な経験と専門知識を活かして、私は Statorials を通じて学生に力を与えるために自分の知識を共有することに尽力しています。もっと知る