Ggplot2を使用してプロットに垂直線を追加する方法
次の構文を使用するgeom_vline()関数を使用すると、ggplot2 プロットに垂直線をすばやく追加できます。
geom_vline(xintercept、線種、色、サイズ)
金:
- xintercept: x 交点に線を追加する場所。 1 つ以上の値を指定できます。
- 線種:線種。デフォルトは「solid」ですが、「twodash」、「longdash」、「dotted」、「dotdash」、「dash」、または「blank」を指定できます。
- color:線の色。
- サイズ:線の幅。
次の例は、この関数を実際に使用する方法を示しています。
パスに 1 本の垂直線を追加する
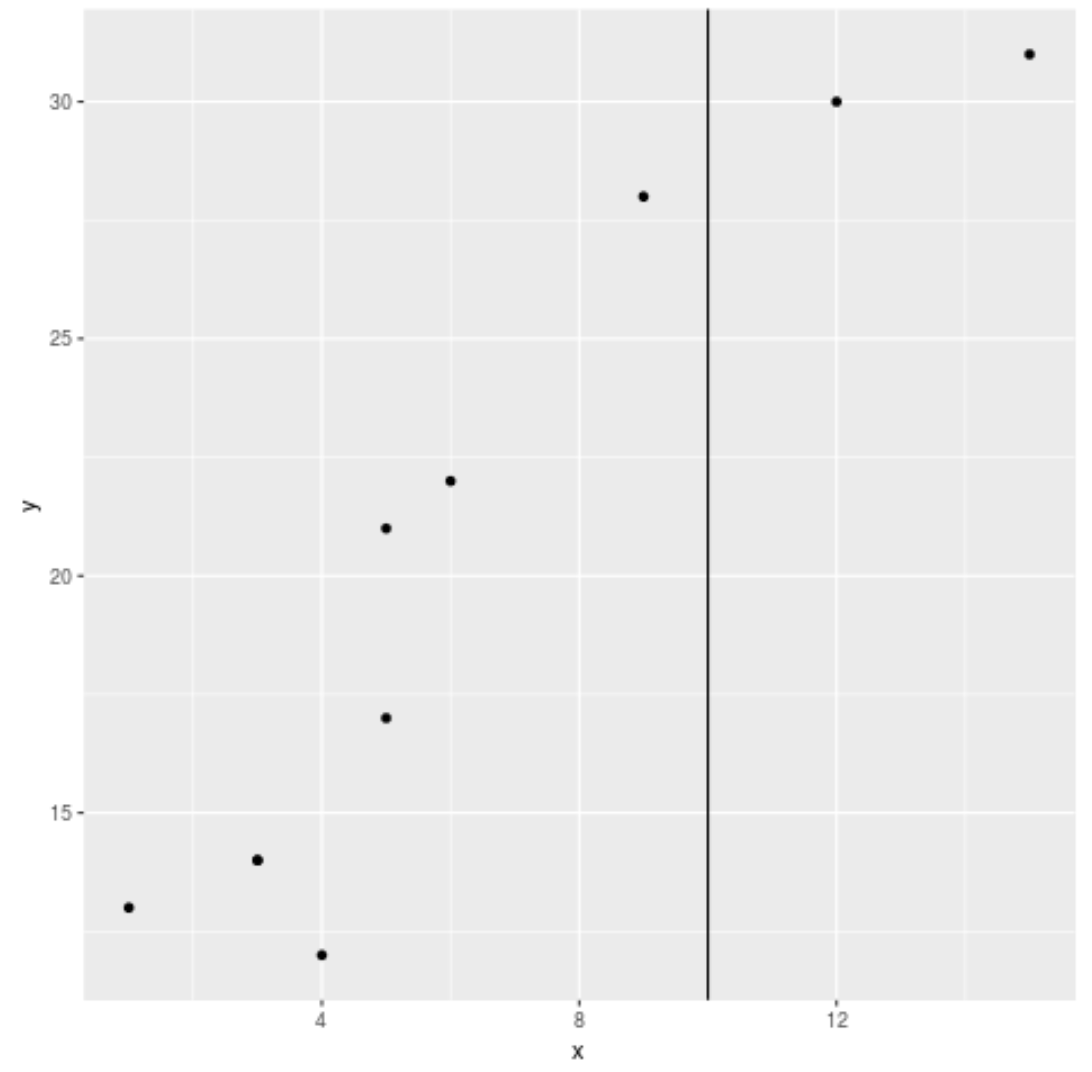
次のコードは、プロットに 1 本の垂直線を追加する方法を示しています。
 library (ggplot2)

#create data frame
df <- data.frame(x=c(1, 3, 3, 4, 5, 5, 6, 9, 12, 15),
                 y=c(13, 14, 14, 12, 17, 21, 22, 28, 30, 31))

#create scatterplot with vertical line at x=10
ggplot(df, aes (x=x, y=y)) +
  geom_point() +
  geom_vline(xintercept= 10 )
パスに複数の垂直線を追加する
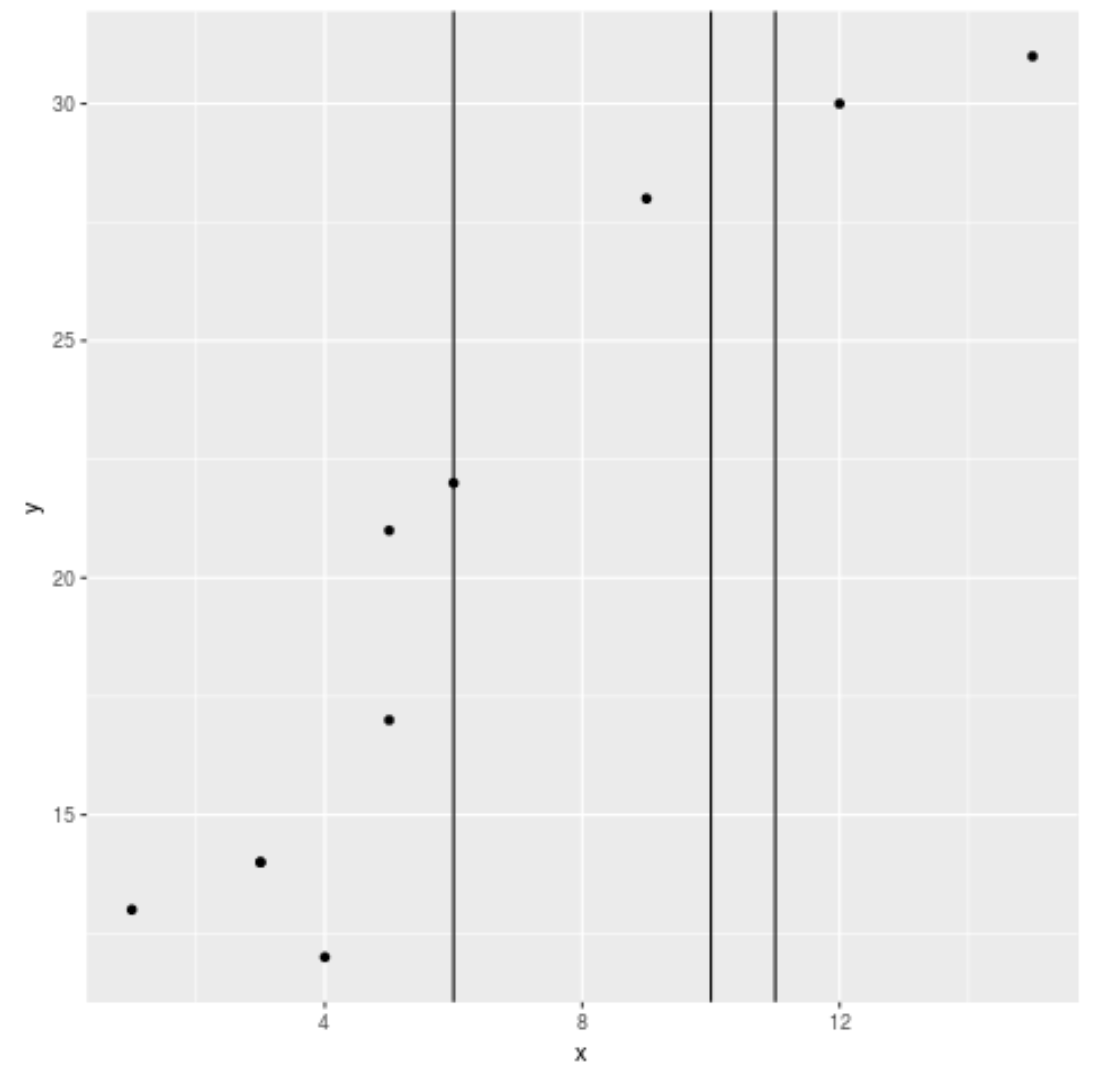
次のコードは、パスに複数の垂直線を追加する方法を示しています。
 library (ggplot2)

#create data frame
df <- data.frame(x=c(1, 3, 3, 4, 5, 5, 6, 9, 12, 15),
                 y=c(13, 14, 14, 12, 17, 21, 22, 28, 30, 31))

#create scatterplot with vertical line at x=6, 10, and 11
ggplot(df, aes (x=x, y=y)) +
  geom_point() +
  geom_vline(xintercept=c( 6, 10, 11 ))
垂直線をカスタマイズする
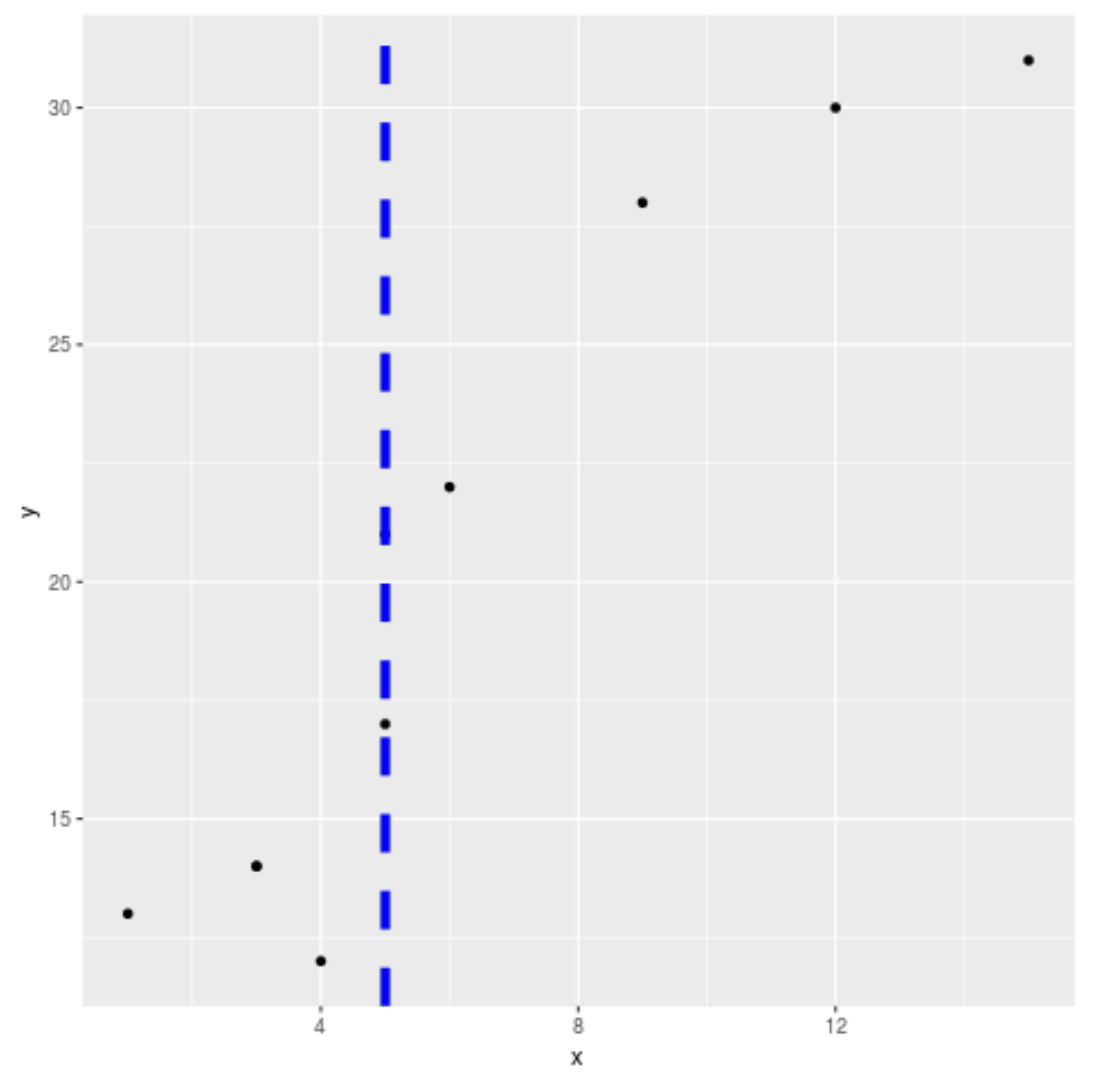
次のコードは、パス上の垂直線をカスタマイズする方法を示しています。
 library (ggplot2)

#create data frame
df <- data.frame(x=c(1, 3, 3, 4, 5, 5, 6, 9, 12, 15),
                 y=c(13, 14, 14, 12, 17, 21, 22, 28, 30, 31))

#create scatterplot with customized vertical line
ggplot(df, aes (x=x, y=y)) +
  geom_point() +
  geom_vline(xintercept= 5 , linetype=' dashed ', color=' blue ', size =2 )
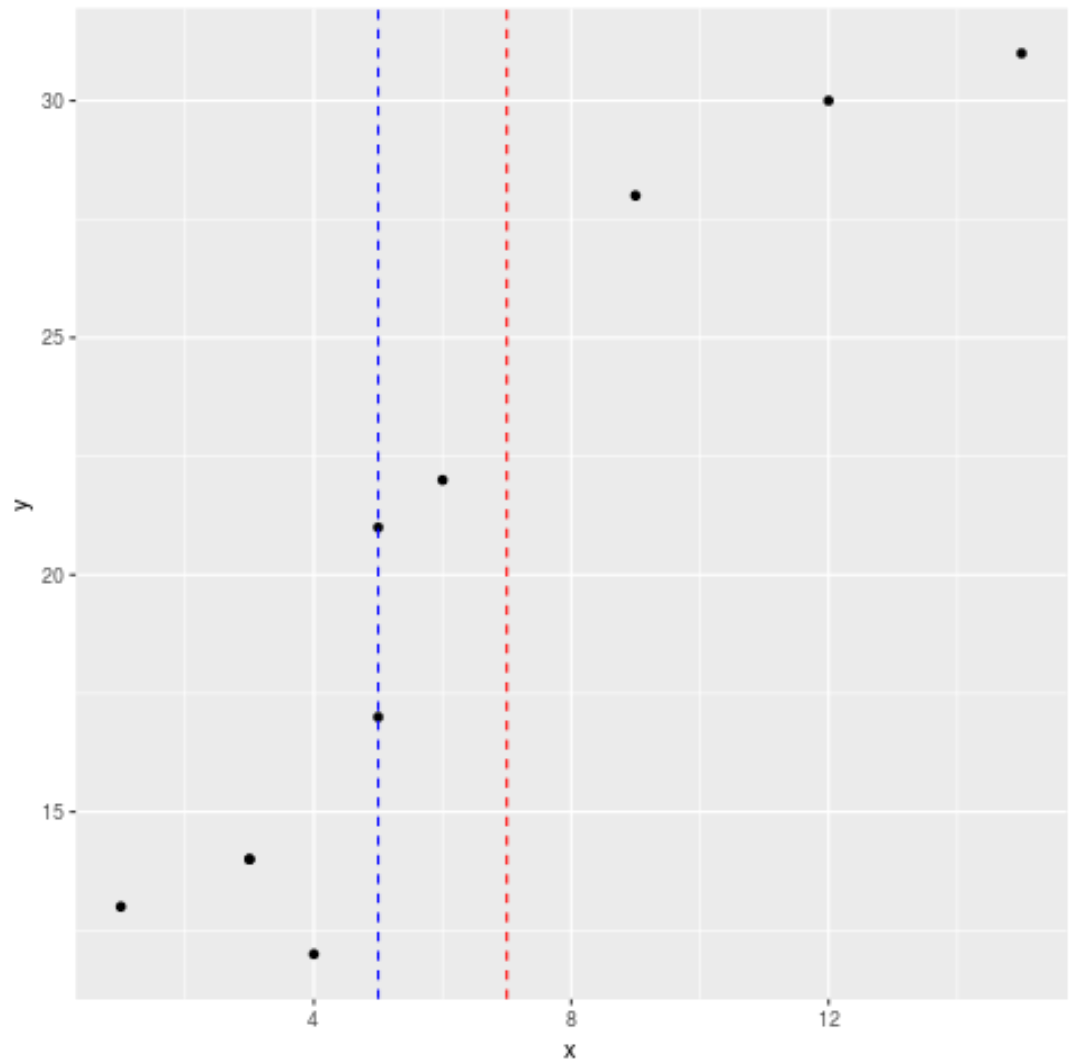
チャート上に複数の垂直線がある場合、各線に固有の色を指定できます。
 library (ggplot2)

#create data frame
df <- data.frame(x=c(1, 3, 3, 4, 5, 5, 6, 9, 12, 15),
                 y=c(13, 14, 14, 12, 17, 21, 22, 28, 30, 31))

#create scatterplot with customized vertical lines
ggplot(df, aes (x=x, y=y)) +
  geom_point() +
  geom_vline(xintercept=c( 5,7 ) , linetype=' dashed ', color=c(' blue ', ' red '))
追加リソース
次のチュートリアルでは、ggplot2 で他の一般的なタスクを実行する方法を説明します。
ggplot2 で線形回帰直線をプロットする方法
ggplot2 で軸の制限を設定する方法
ggplot2 で並列プロットを作成する方法
著者について
ベンジャミン・アンダーソン博士
私はベンジャミンです。退職した統計教授から、専任の Statorials 教育者になりました。 統計分野における豊富な経験と専門知識を活かして、私は Statorials を通じて学生に力を与えるために自分の知識を共有することに尽力しています。もっと知る