Ggplot2 プロットにテキストを追加する方法 (例付き)
annotate()関数を使用して、ggplot2 のプロットにテキストを追加できます。
この関数は次の基本構文を使用します。
 p+
  annotate(" text ", x= 6 , y= 10 , label= " hello ")
金:
- x, y : テキストを配置する座標 (x, y)。
- label : 表示するテキスト。
次の例は、この関数を実際に使用する方法を示しています。
例 1: ggplot2 にテキスト要素を追加する
次のコードは、 annotate() を使用して ggplot2 散布図にテキスト要素を追加する方法を示しています。
 library (ggplot2)

#create data frame
df <- data. frame (x=c(1, 3, 3, 5, 7, 8, 10, 11),
                 y=c(3, 5, 7, 5, 8, 10, 14, 19))

#create scatter plot with one text element
ggplot(df, aes(x=x, y=y)) +
  geom_point()
  annotate(" text ", x= 6 , y= 10 , label= " hello ")
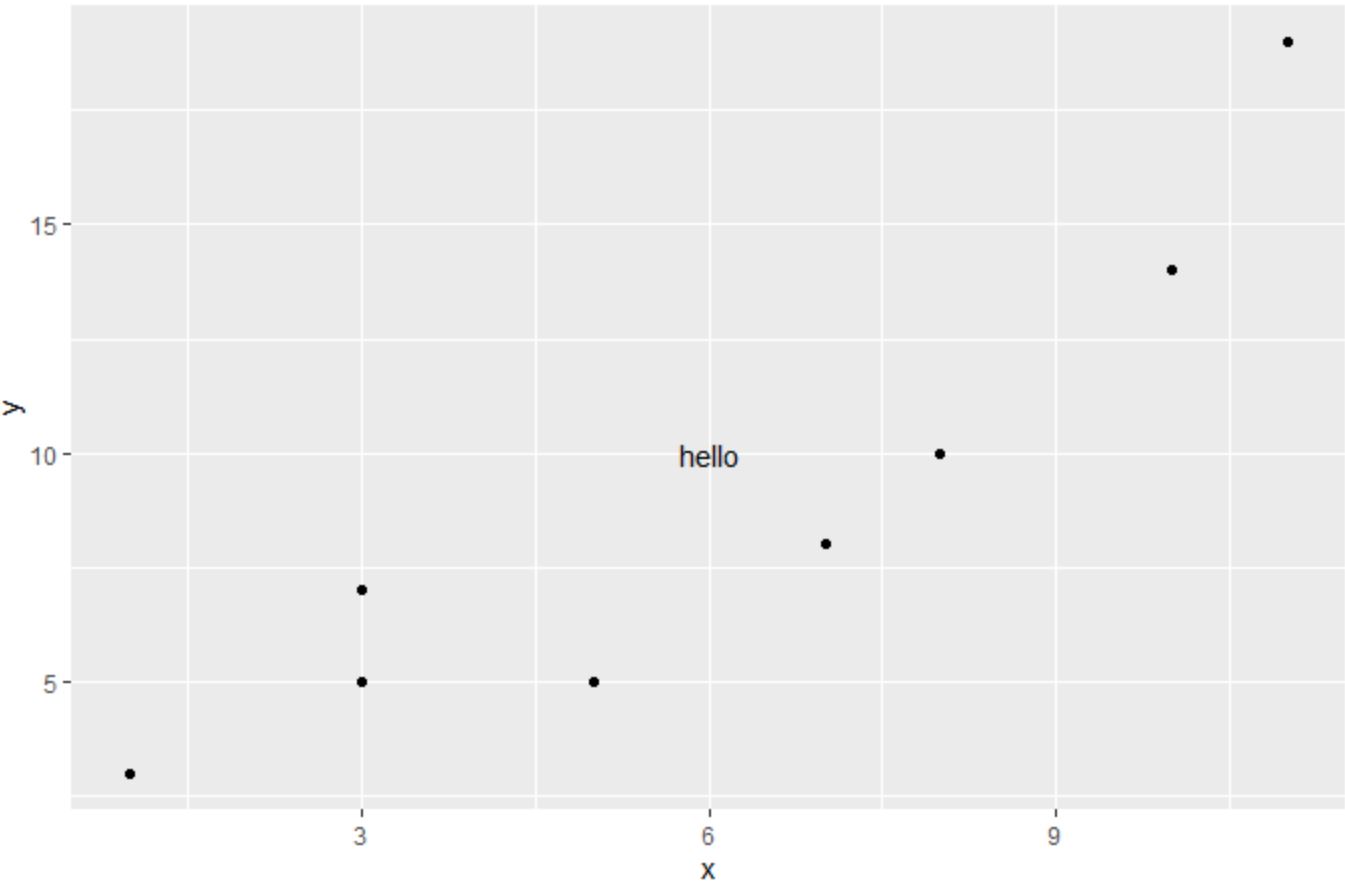
テキスト要素がプロット内の (6, 10) の (x, y) 座標に追加されていることに注目してください。
例 2: 複数のテキスト要素を ggplot2 に追加する
次のコードは、 annotate()を使用して複数のテキスト要素を ggplot2 散布図に追加する方法を示しています。
 library (ggplot2)

#create data frame
df <- data. frame (x=c(1, 3, 3, 5, 7, 8, 10, 11),
                 y=c(3, 5, 7, 5, 8, 10, 14, 19))

#create scatter plot with one text element
ggplot(df, aes(x=x, y=y)) +
  geom_point() +
  annotate(" text ", x= 6 , y= 10 , label= " hello ") +
  annotate(" text ", x= 3 , y= 15 , label= " hello again ")
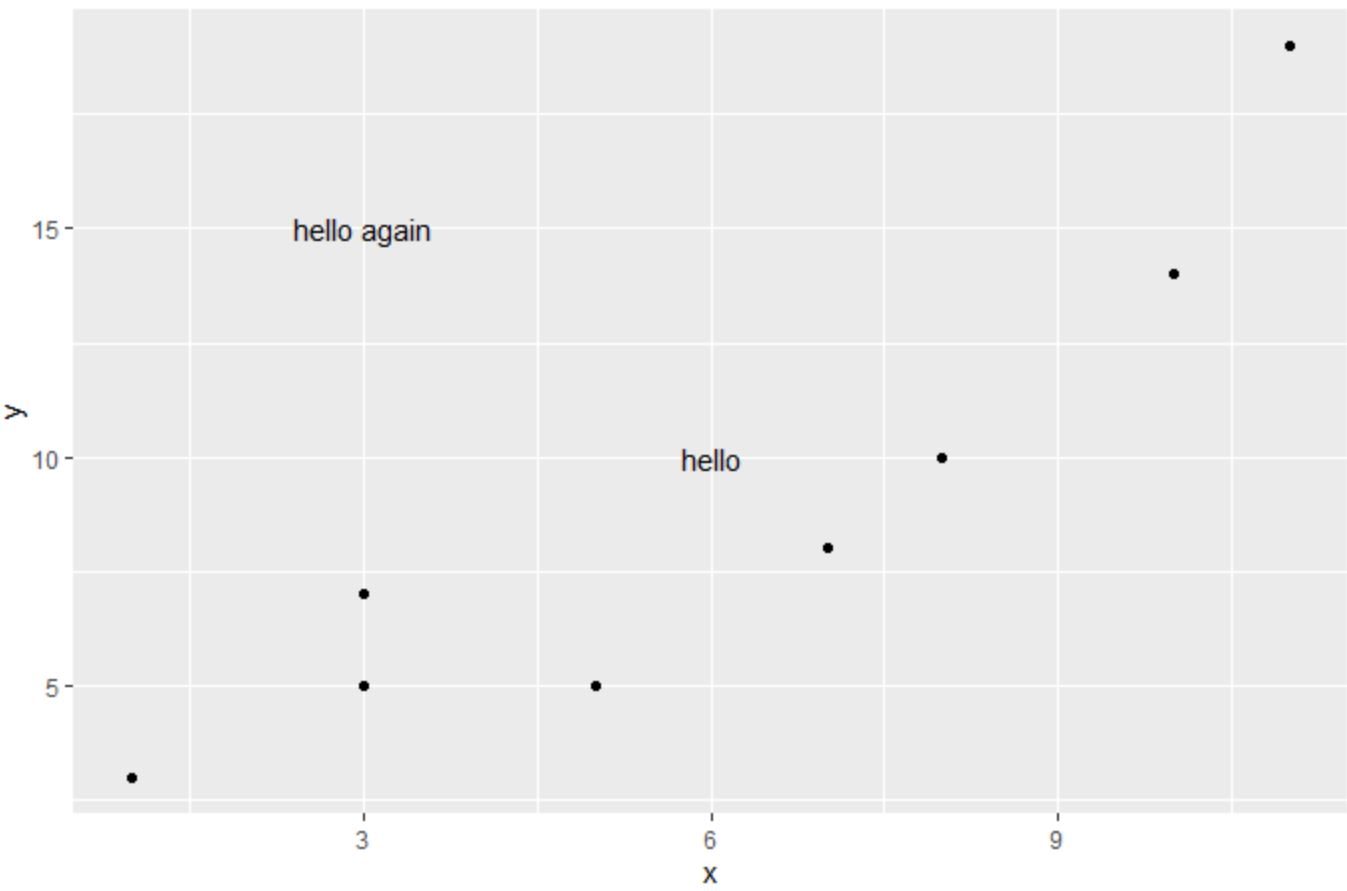
プロットの指定した座標に 2 つのテキスト要素が追加されていることに注目してください。
例 3: プロット内のテキスト要素をカスタマイズする
size 、 col 、およびitalicまたは太字の引数を使用して、プロット内のテキスト要素のサイズ、色、フォント スタイルをそれぞれカスタマイズできます。
 library (ggplot2)

#create data frame
df <- data. frame (x=c(1, 3, 3, 5, 7, 8, 10, 11),
                 y=c(3, 5, 7, 5, 8, 10, 14, 19))

#create scatter plot with custom text element
ggplot(df, aes(x=x, y=y)) +
  geom_point() +
  annotate(" text ", x= 6 , y= 10 , label= " bolditalic(hello) ",
           col=" blue ", size= 10 , parse= TRUE )
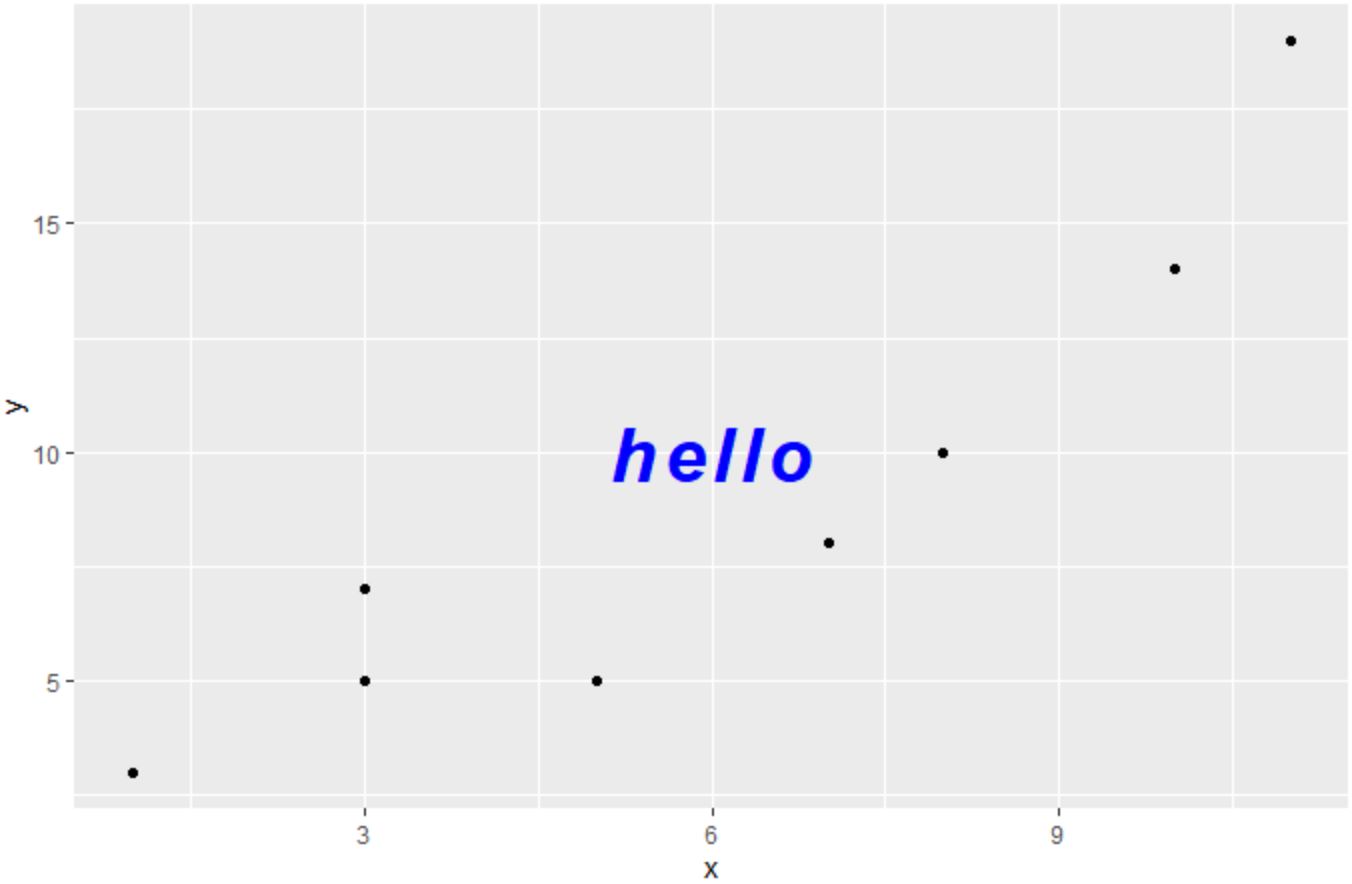
プロット内の唯一のテキスト要素が太字、斜体、青で、サイズが 10 であることに注意してください。
注: ggplot2 のannotate()関数の完全なドキュメントは、ここで見つけることができます。
追加リソース
次のチュートリアルでは、R で他の一般的なタスクを実行する方法について説明します。
ggplot2でポイントサイズを変更する方法
ggplot2でタイトルの位置を変更する方法
ggplot2で軸ラベルを削除する方法
著者について
ベンジャミン・アンダーソン博士
私はベンジャミンです。退職した統計教授から、専任の Statorials 教育者になりました。 統計分野における豊富な経験と専門知識を活かして、私は Statorials を通じて学生に力を与えるために自分の知識を共有することに尽力しています。もっと知る