Ggplot2で凡例項目間の間隔を変更する方法
次のメソッドを使用して、ggplot2 の凡例要素間の間隔を変更できます。
方法 1: 水平方向の間隔を変更する
 p+
  theme(legend. spacing . x = unit(1, ' cm '))
方法 2: 垂直方向の間隔を変更する
 p+
  theme(legend. spacing . y = unit(1, ' cm ')) +
  guides(fill = guide_legend(byrow = TRUE ))
次の例は、次のデータ フレームで各メソッドを実際に使用する方法を示しています。
 #create data frame
df <- data. frame (team=c('Mavs', 'Heat', 'Nets', 'Lakers', 'Suns', 'Cavs'),
                 points=c(24, 20, 34, 39, 28, 29),
                 assists=c(5, 7, 6, 9, 12, 13))

#view data frame
df

    team points assists
1 Mavs 24 5
2 Heat 20 7
3 Nets 34 6
4 Lakers 39 9
5 Suns 28 12
6 Cavs 29 13
例 1: 凡例要素間の水平方向の間隔を変更する
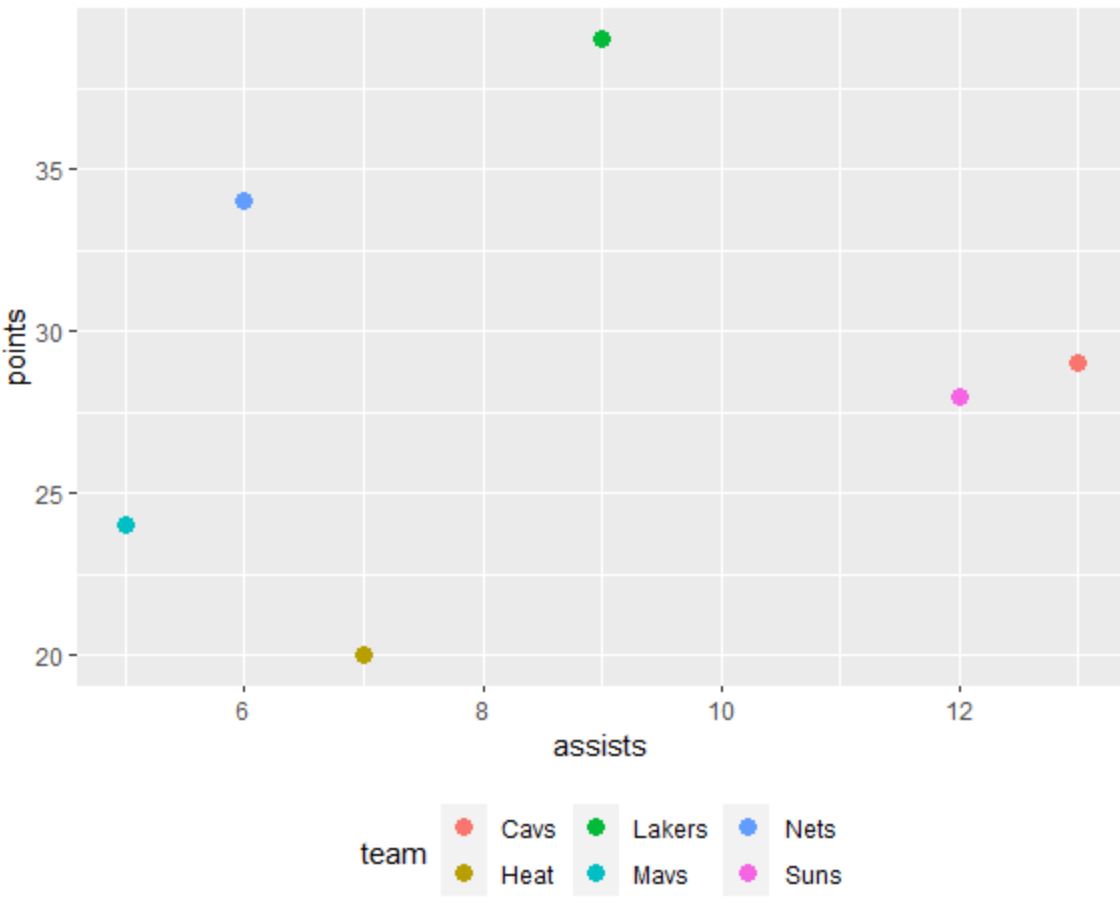
次のコードは、デフォルトの間隔で水平方向の凡例を含む散布図を ggplot2 で作成する方法を示しています。
 library (ggplot2)

#create scatterplot with default spacing in legend
ggplot(df, aes(x=assists, y=points, color=team)) +
  geom_point(size= 3 ) +
  theme(legend. position = ' bottom ')

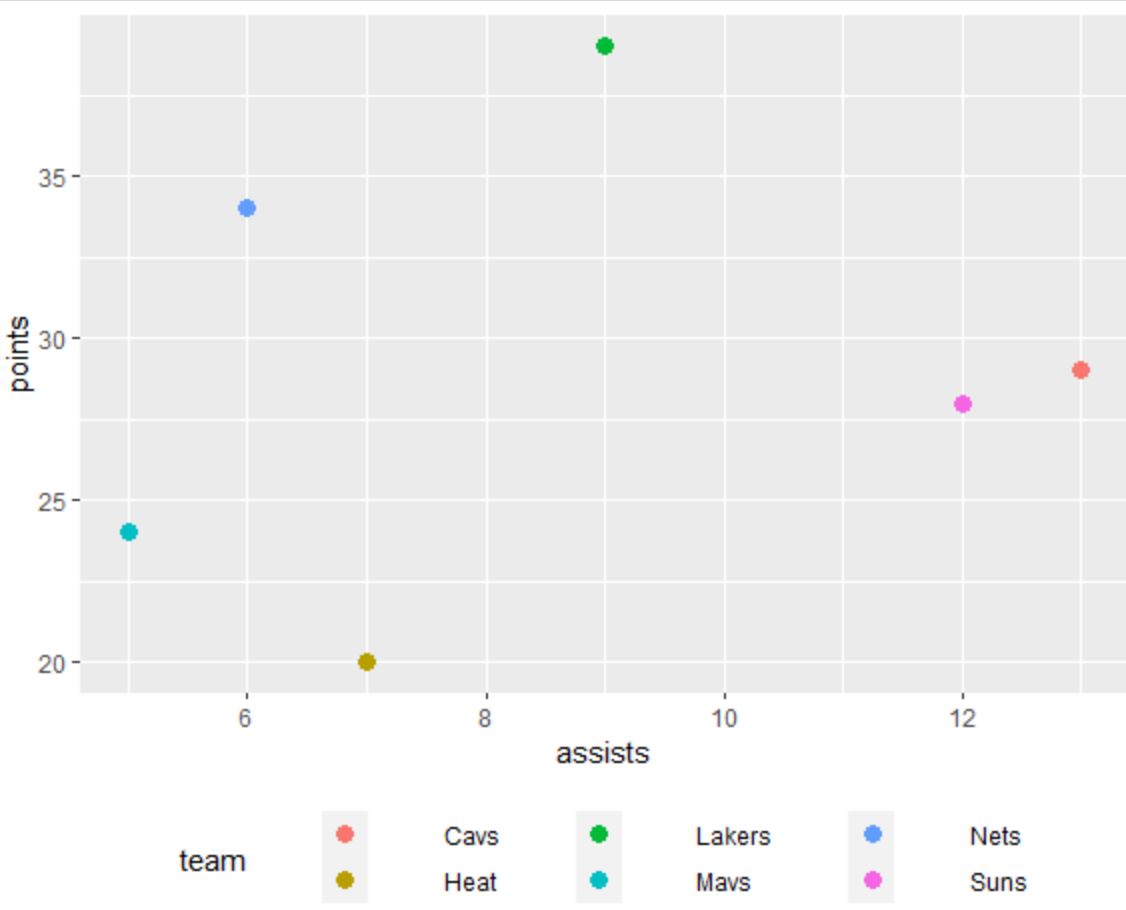
凡例要素間の水平方向の間隔を広げるには、 legend.spacing.x引数を使用できます。
 library (ggplot2)

#create scatterplot with increased horizontal spacing in legend
ggplot(df, aes(x=assists, y=points, color=team)) +
  geom_point(size= 3 ) +
  theme(legend. position = ' bottom ',
        legend. spacing . x = unit(1, ' cm '))

凡例要素間の水平方向の間隔が増加していることに注意してください。
Unit()関数で使用する値が大きいほど、要素間の間隔が大きくなります。
例 2: キャプション要素間の垂直方向の間隔を変更する
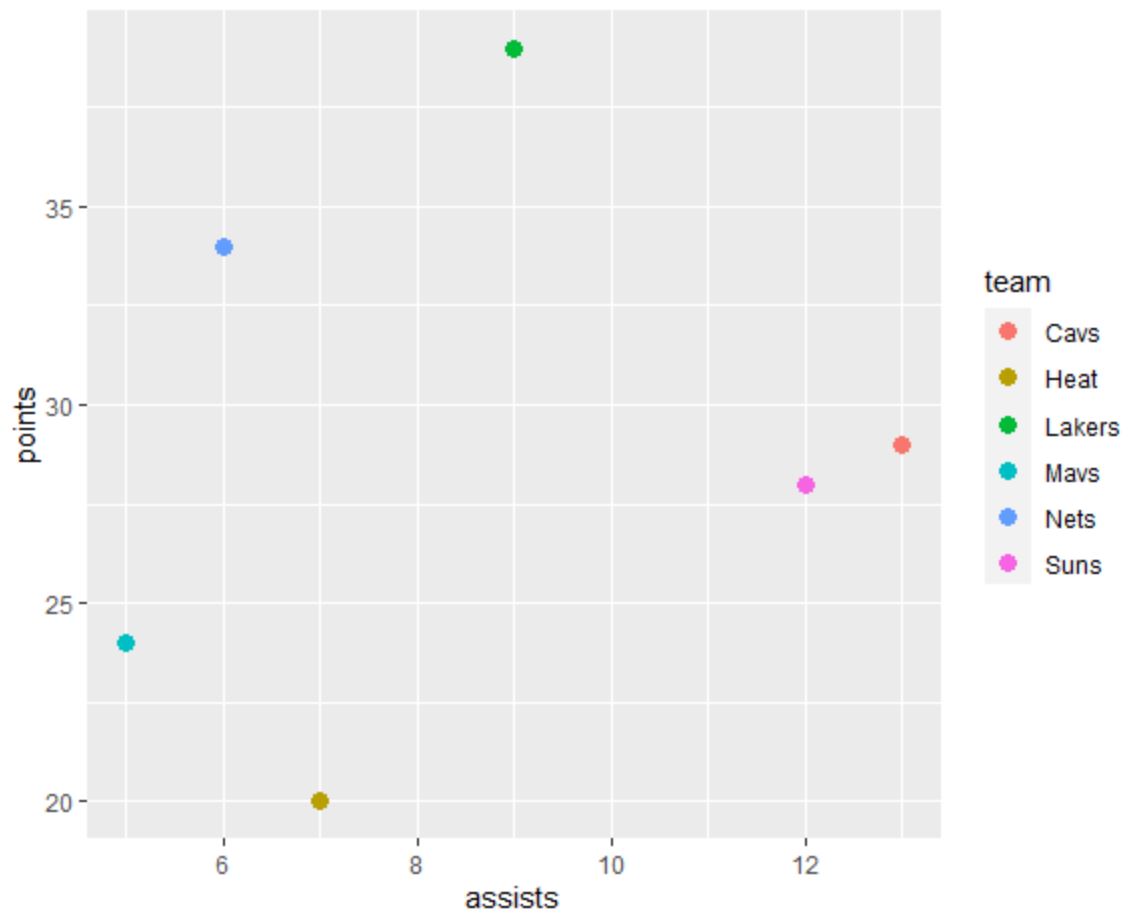
次のコードは、デフォルトの間隔で垂直方向の凡例を含む散布図を ggplot2 で作成する方法を示しています。
 library (ggplot2)

#create scatterplot with default spacing in legend
ggplot(df, aes(x=assists, y=points, color=team)) +
  geom_point(size= 3 )

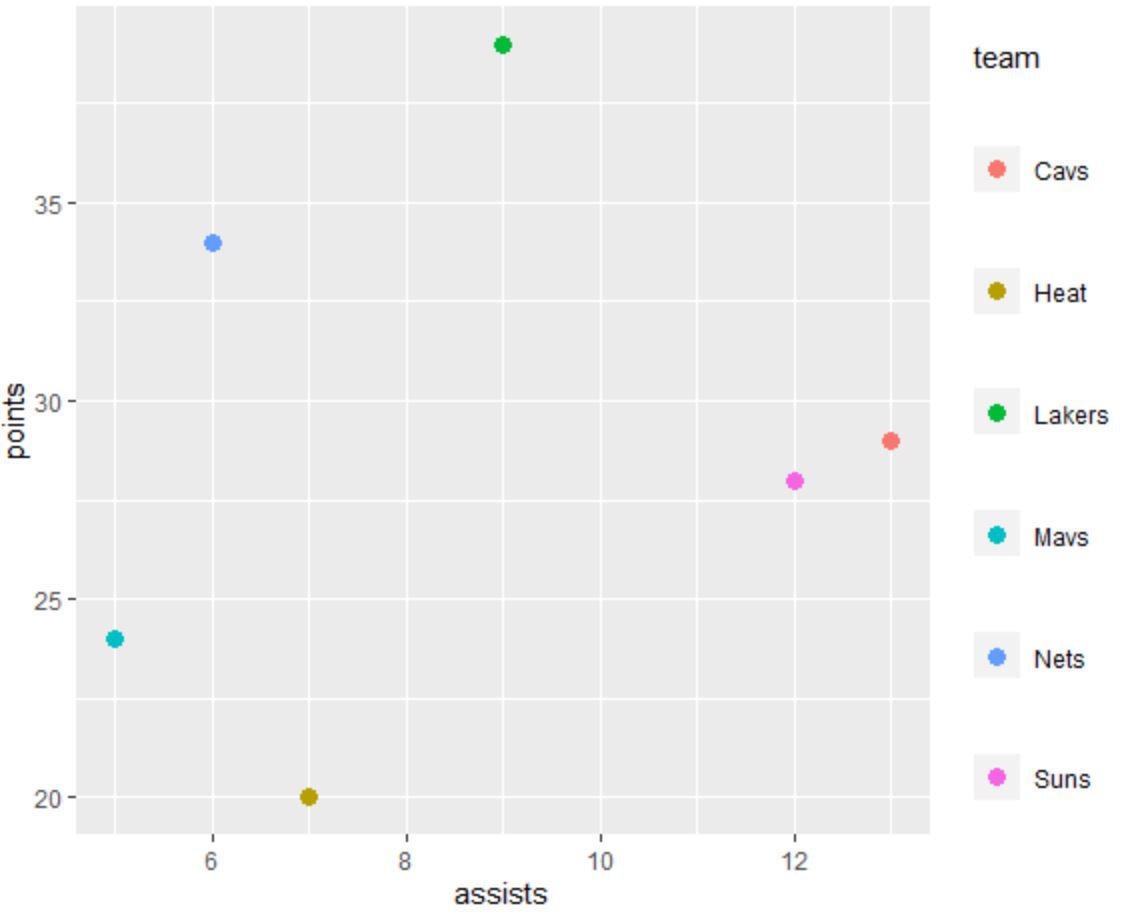
凡例要素間の垂直方向の間隔を広げるには、 legend.spacing.y引数を使用できます。
 library (ggplot2)

#create scatterplot with increased vertical spacing in legend
ggplot(df, aes(x=assists, y=points, color=team)) +
  geom_point(size= 3 ) +
  theme(legend. spacing . y = unit(1, ' cm ')) +
  guides(fill = guide_legend(byrow = TRUE ))

凡例要素間の垂直方向の間隔が増加していることに注意してください。
Unit()関数で使用する値が大きいほど、要素間の間隔が大きくなります。
注: byrow = TRUE引数を使用する最後の行を含める必要があります。そうしないと、凡例要素の間隔が期待どおりに配置されません。
追加リソース
次のチュートリアルでは、ggplot2 で他の一般的な操作を実行する方法を説明します。
ggplot2で凡例のタイトルを変更する方法
ggplot2で凡例のサイズを変更する方法
ggplot2で凡例の位置を変更する方法