Ggplot2 で注釈付きテキストを回転する方法 (例あり)
次の基本構文を使用して、ggplot2 プロット内の注釈付きテキストを回転できます。
 ggplot(df) +
  geom_point(aes(x=x, y=y)) +
  geom_text(aes(x=x, y=y, label=group), hjust= -0.3 , vjust= -0.1 , angle= 45 )
この特定の例では、 angle引数を使用して注釈付きテキストを反時計回りに 45 度回転し、 hjustおよびvjust引数を使用してトレース上の点からテキストの水平方向および垂直方向の距離を増やします。
次の例は、この構文を実際に使用する方法を示しています。
例: ggplot2 で注釈付きテキストを回転する
R に次のデータセットがあるとします。
 #create data frame
df <- data. frame (player=c('Brad', 'Ty', 'Spencer', 'Luke', 'Max'),
                 dots=c(17, 5, 12, 20, 22),
                 assists=c(4, 3, 7, 7, 5))

#view data frame
df

   player points assists
1 Brad 17 4
2 Ty 5 3
3 Spencer 12 7
4 Luke 20 7
5 Max 22 5
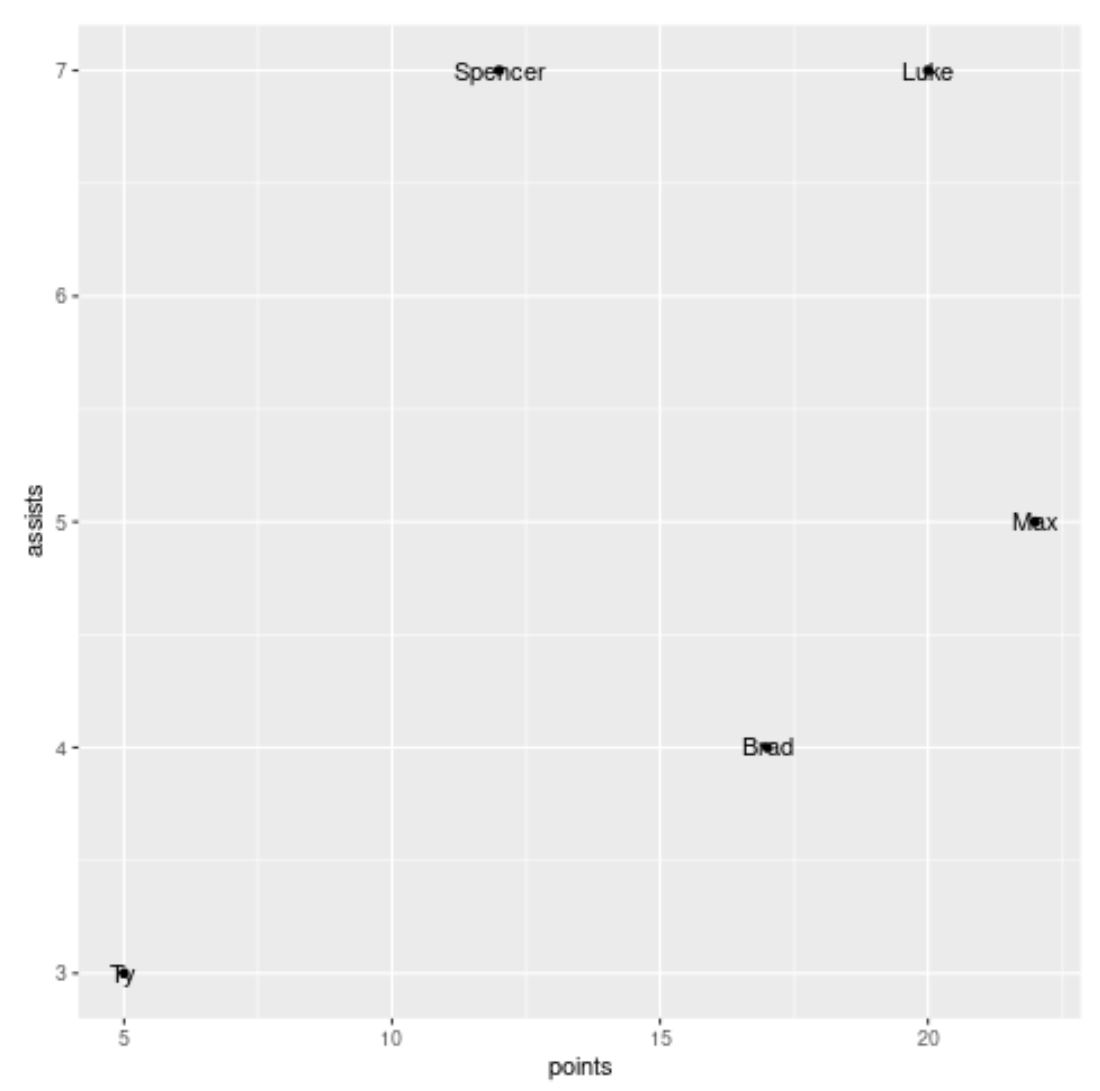
ここで、このデータを視覚化するために ggplot2 で次の散布図を作成するとします。
 library (ggplot2)

#create scatter plot with annotated labels
ggplot(df) +
  geom_point(aes(x=points, y=assists)) +
  geom_text(aes(x=points, y=assists, label=player))

ラベルは水平であり、ポイントの真上に配置されていることに注意してください。
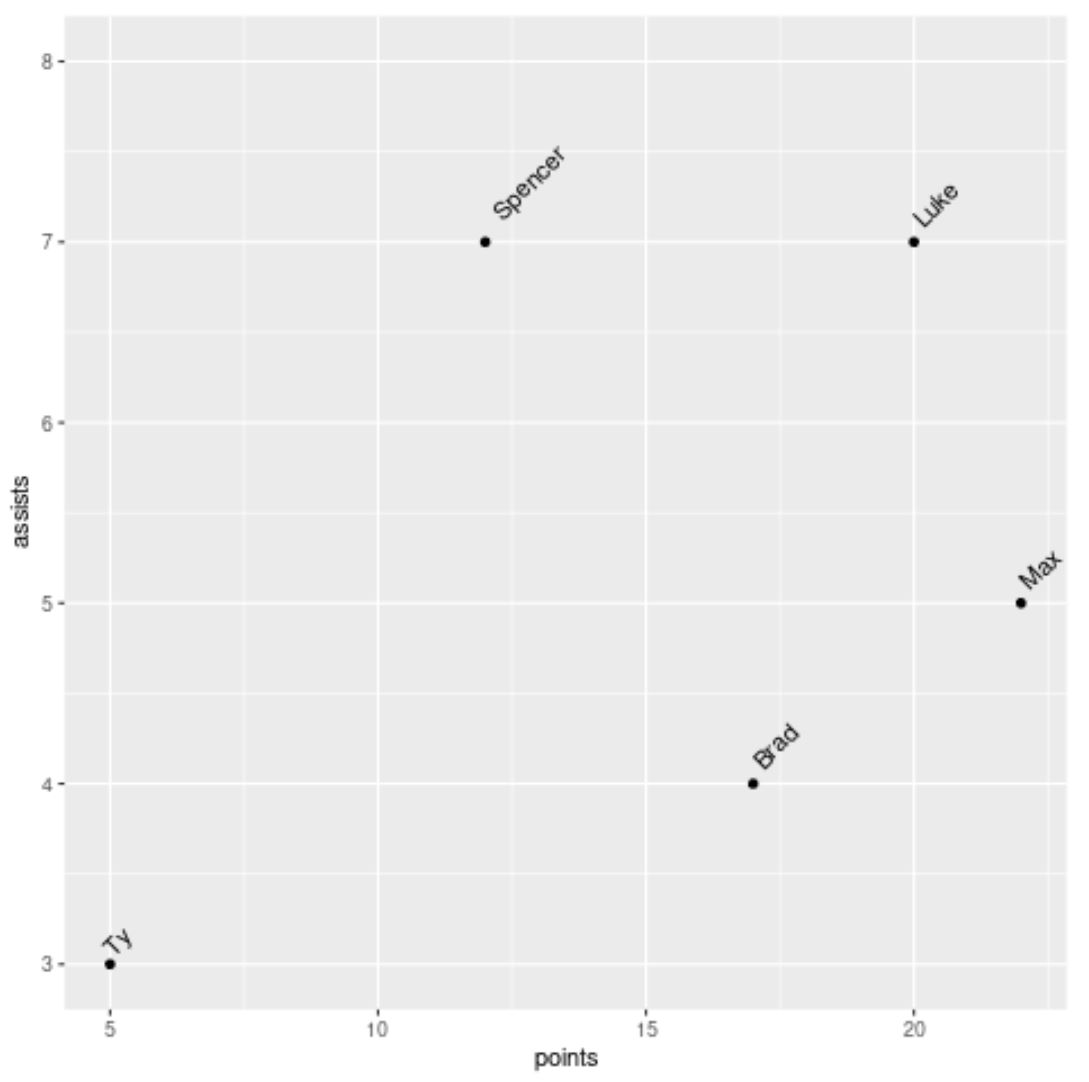
次の構文を使用して、ラベルを回転し、ポイントからわずかに離してラベルを読みやすくすることができます。
 library (ggplot2)

#create scatter plot with annotated rotated labels
ggplot(df) +
  geom_point(aes(x=points, y=assists)) +
  geom_text(aes(x=points, y=assists, label=player), hjust= -.3 , vjust= -.1 , angle= 45 ) +
  ylim(3, 8)

ラベルがすべて反時計回りに 45 度回転していることに注意してください。
hjust 、 vjust 、およびangle引数を自由に操作して、注釈付きテキストをプロット上の希望の位置に配置してください。
注: また、プロットの上部にある「Spencer」ラベルが切り取られないように、 ylim引数を使用してプロットのy 軸の境界を増やしました。
追加リソース
次のチュートリアルでは、R で他の一般的なタスクを実行する方法について説明します。
ggplot2 で軸ラベルを回転する方法
ggplot2でポイントサイズを変更する方法
ggplot2 プロットにテキストを追加する方法