Matplotlib で tight_layout() を使用する方法
Matplotlib のTight_layout()関数を使用すると、サブプロットの間および周囲のパディングを自動的に調整できます。
次の例は、この関数を実際に使用する方法を示しています。
例: Matplotlib で Tight_layout() を使用する方法
Matplotilb を使用して 2×2 グリッドに 4 つのサブプロットを作成するとします。
 import matplotlib. pyplot as plt

#define data
x = [1, 2, 3]
y = [7, 13, 24]

#define layout for subplots
fig, ax = plt. subplots (2, 2)

#define subplot titles
ax[0, 0]. plot (x,y,color=' red ')
ax[0, 1]. plot (x,y,color=' blue ')
ax[1, 0]. plot (x,y,color=' green ')
ax[1, 1]. plot (x,y,color=' purple ')

#add title to each subplot
ax[0, 0]. set_title (' First Subplot ')
ax[0, 1]. set_title (' Second Subplot ')
ax[1, 0]. set_title (' Third Subplot ')
ax[1, 1]. set_title (' Fourth Subplot ')
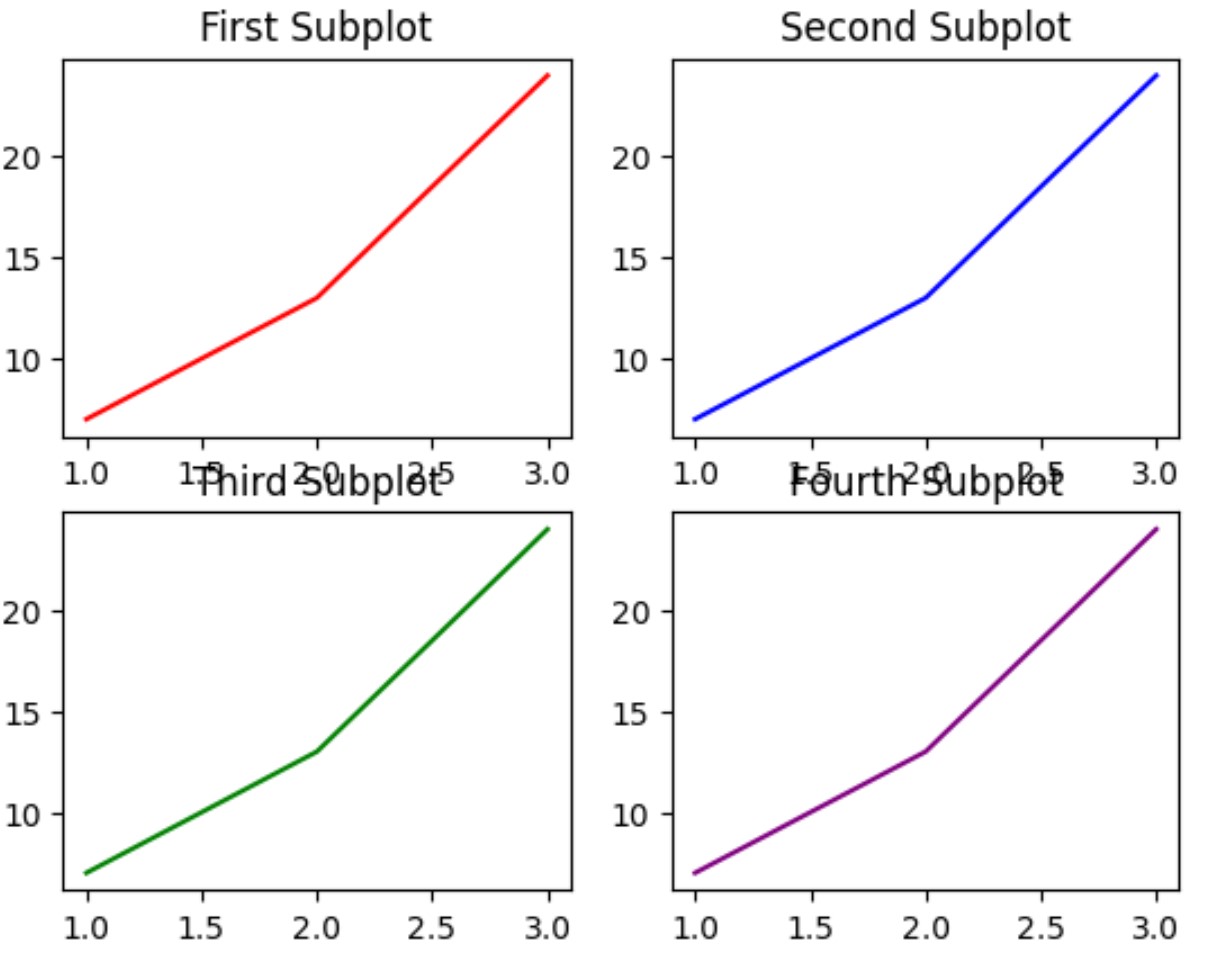
サブプロット間のパディングは最小限であるため、一部の場所でタイトルが重複することに注意してください。
fig.tight_layout()を指定すると、サブプロット間およびサブプロットの周囲のパディングを自動的に調整できます。
 import matplotlib. pyplot as plt

#define data
x = [1, 2, 3]
y = [7, 13, 24]

#define layout for subplots
fig, ax = plt. subplots (2, 2)

#specify a tight layout
fig. tight_layout ()

#define subplot titles
ax[0, 0]. plot (x,y,color=' red ')
ax[0, 1]. plot (x,y,color=' blue ')
ax[1, 0]. plot (x,y,color=' green ')
ax[1, 1]. plot (x,y,color=' purple ')

#add title to each subplot
ax[0, 0]. set_title (' First Subplot ')
ax[0, 1]. set_title (' Second Subplot ')
ax[1, 0]. set_title (' Third Subplot ')
ax[1, 1]. set_title (' Fourth Subplot ')
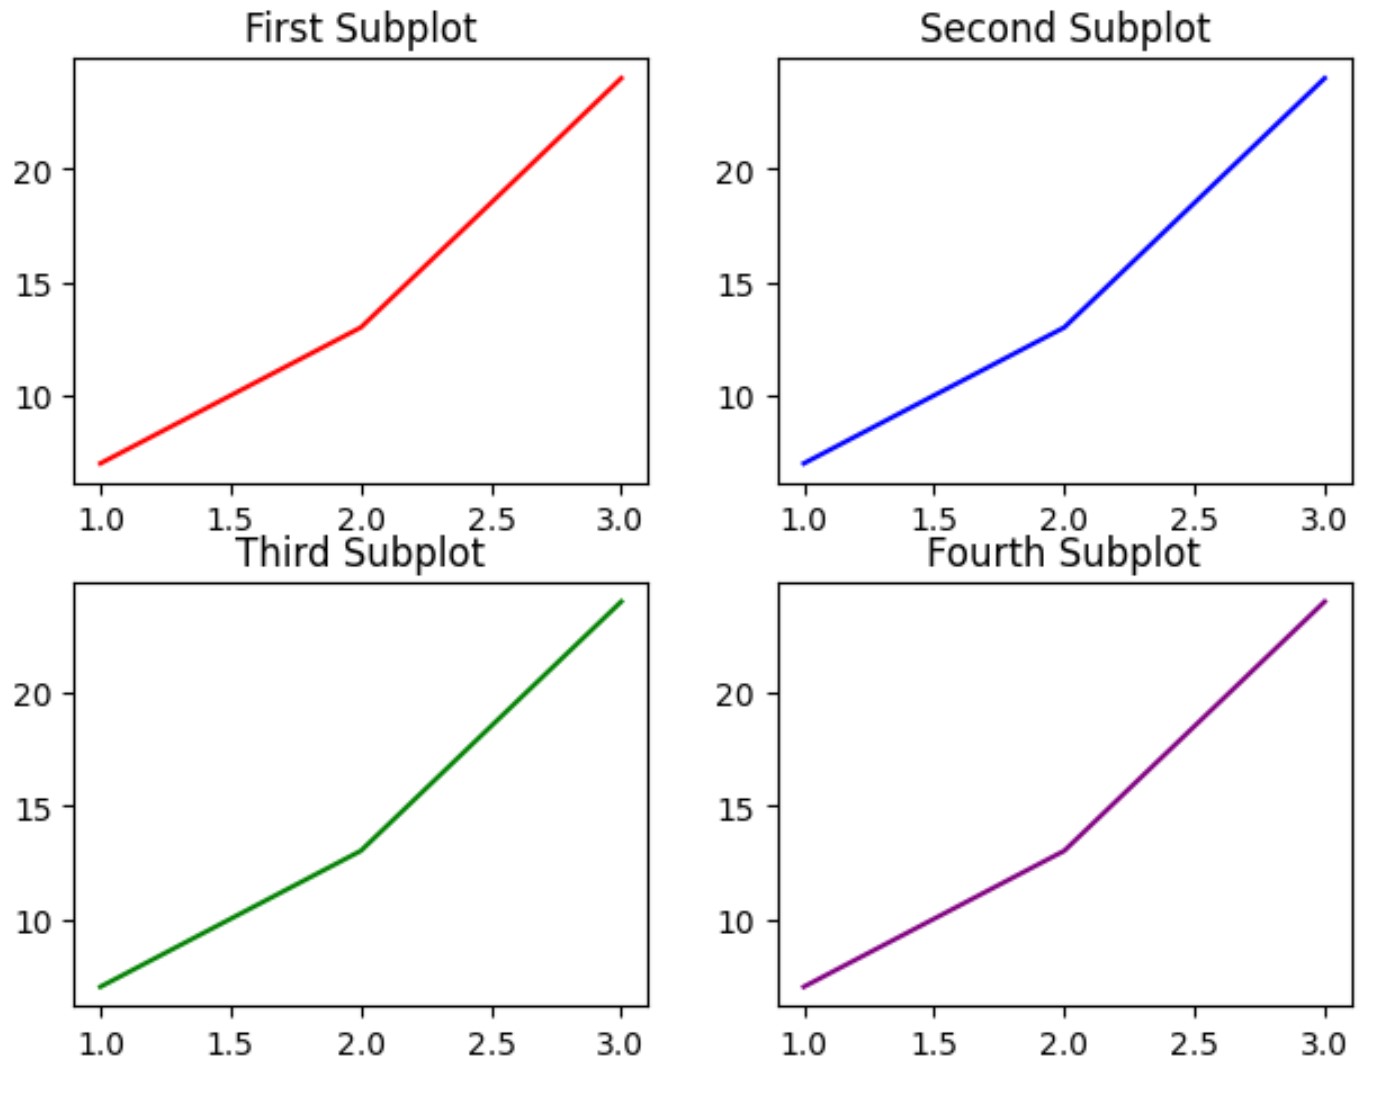
サブプロットの間および周囲のパディングが調整され、どの領域でもプロットが重ならないようになっていることに注意してください。
Tight_layout()関数は、図の端とサブパスの端の間のパディングをフォント サイズの一部として指定するパッド引数を取ることに注意してください。
デフォルトのパッド値は1.08です。ただし、この値を増やすと、パスの周囲のパディングを増やすことができます。
 import matplotlib. pyplot as plt

#define data
x = [1, 2, 3]
y = [7, 13, 24]

#define layout for subplots
fig, ax = plt. subplots (2, 2)

#specify a tight layout with increased padding
fig. tight_layout (pad=5)

#define subplot titles
ax[0, 0]. plot (x,y,color=' red ')
ax[0, 1]. plot (x,y,color=' blue ')
ax[1, 0]. plot (x,y,color=' green ')
ax[1, 1]. plot (x,y,color=' purple ')

#add title to each subplot
ax[0, 0]. set_title (' First Subplot ')
ax[0, 1]. set_title (' Second Subplot ')
ax[1, 0]. set_title (' Third Subplot ')
ax[1, 1]. set_title (' Fourth Subplot ')
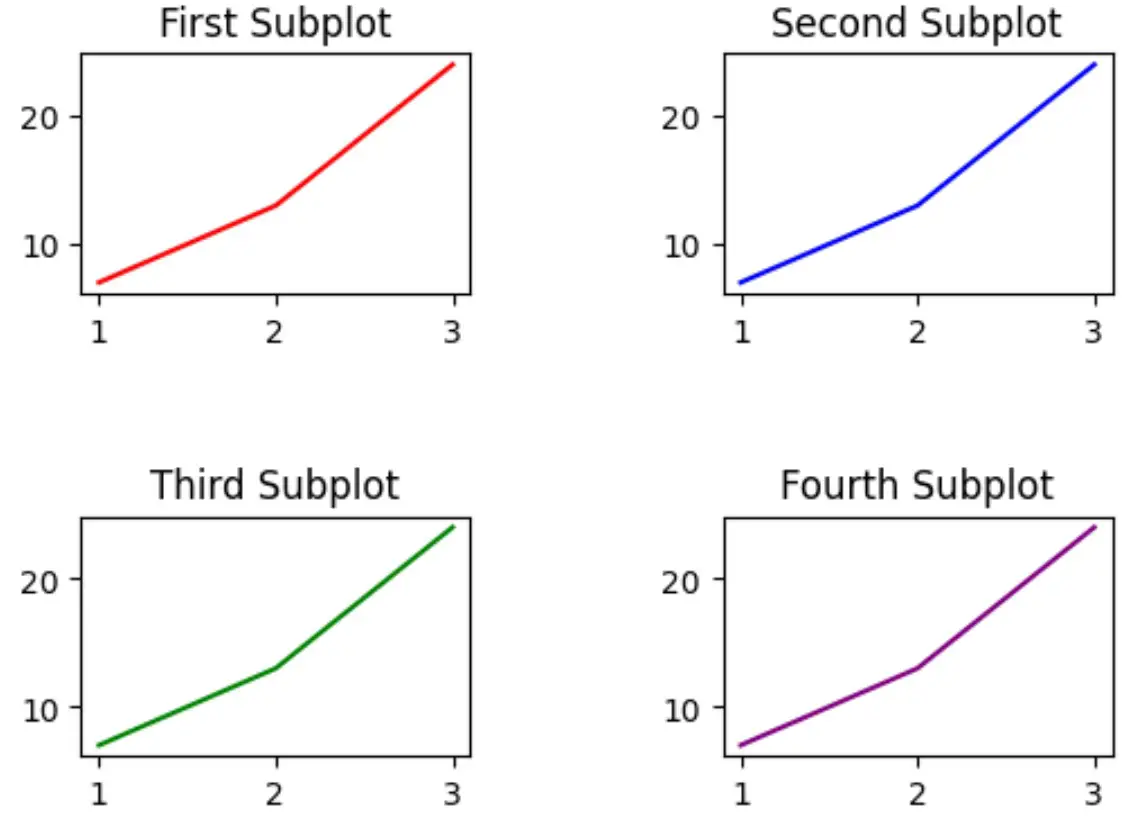
プロットの周囲の充填が著しく増加していることに注意してください。
パスの周囲のパディングを好きなだけ増やすために、 pad引数の値を自由に調整してください。
追加リソース
次のチュートリアルでは、Matplotlib で他の一般的なタスクを実行する方法を説明します。
Matplotlib でサブプロットにタイトルを追加する方法
Matplotlib でサブプロット サイズを調整する方法
Matplotlib サブプロット間の間隔を調整する方法
著者について
ベンジャミン・アンダーソン博士
私はベンジャミンです。退職した統計教授から、専任の Statorials 教育者になりました。 統計分野における豊富な経験と専門知識を活かして、私は Statorials を通じて学生に力を与えるために自分の知識を共有することに尽力しています。もっと知る