Matplotlib でティック数を変更する方法
次の構文を使用して、Matplotlib の各軸のティック数を変更できます。
 #specify number of ticks on x-axis
plt. locator_params (axis=' x ', nbins= 4 )

#specify number of ticks on y-axis
plt. locator_params (axis=' y ', nbins= 2 )
nbins引数は、各軸に表示するティック数を指定します。
次の例は、この構文を実際に使用する方法を示しています。
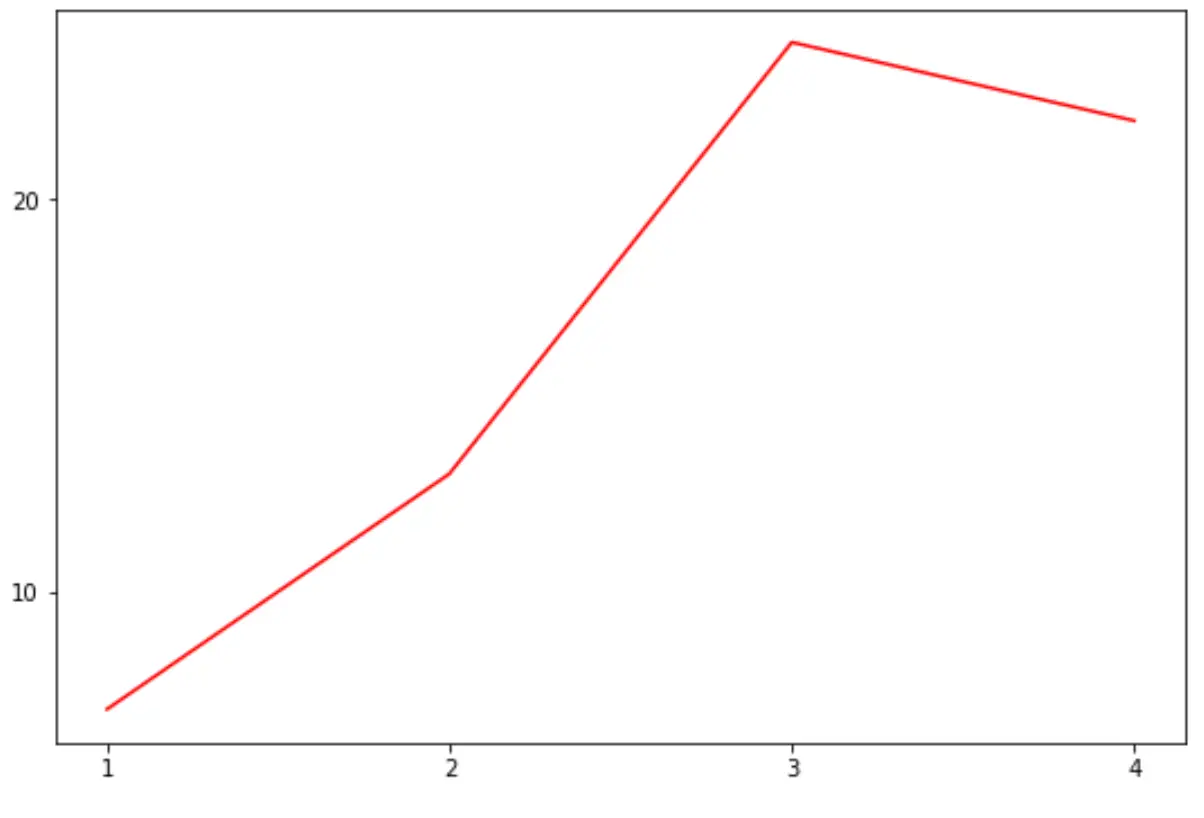
例 1: 両方の軸のティック数を指定する
次のコードは、プロットの軸上の両方の目盛数を指定する方法を示しています。
 import matplotlib. pyplot as plt

#define data
x = [1, 2, 3, 4]
y = [7, 13, 24, 22]

#createplot
plt. plot (x,y,color=' red ')

#specify number of ticks on axes
plt. locator_params (axis=' x ', nbins= 4 )
plt. locator_params (axis=' y ', nbins= 2 )

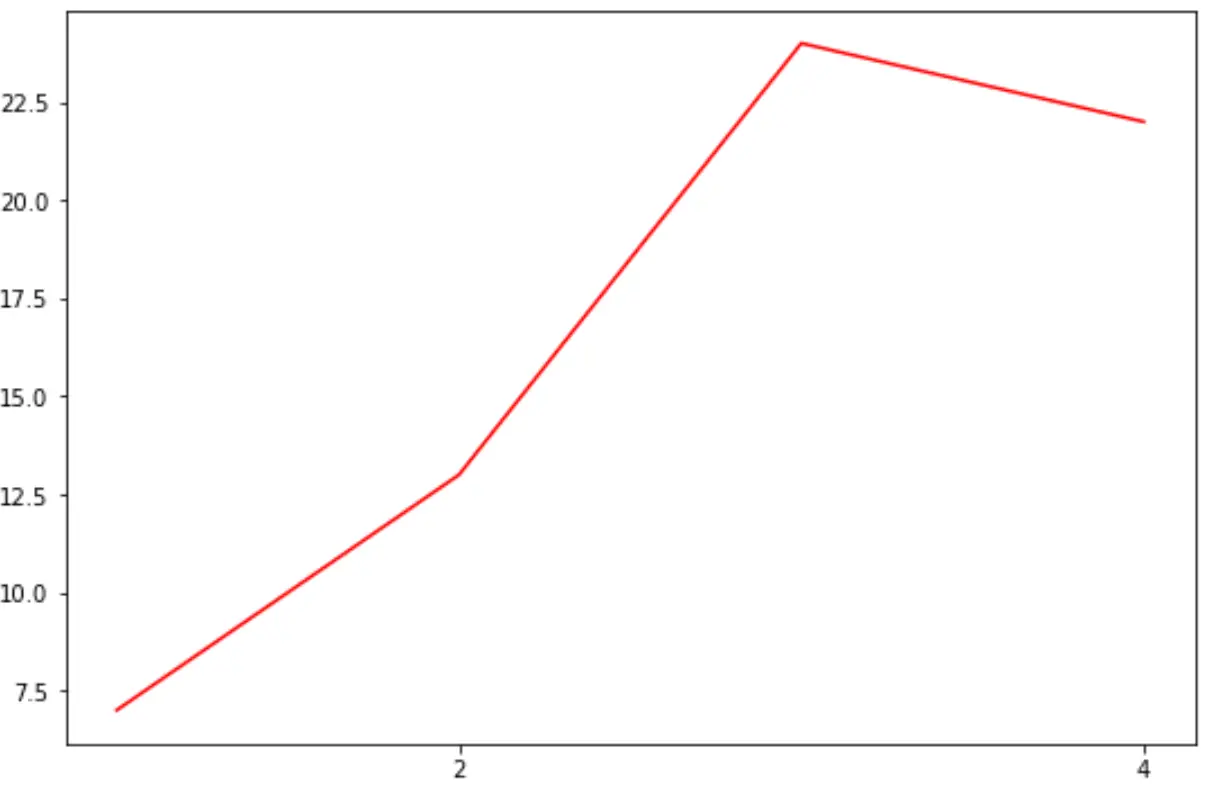
例 2: X 軸の目盛りの数のみを指定する
次のコードは、X 軸のみのティック数を指定する方法を示しています。
 import matplotlib. pyplot as plt

#define data
x = [1, 2, 3, 4]
y = [7, 13, 24, 22]

#createplot
plt. plot (x,y,color=' red ')

#specify number of ticks on x-axis
plt. locator_params (axis=' x ', nbins= 2 )

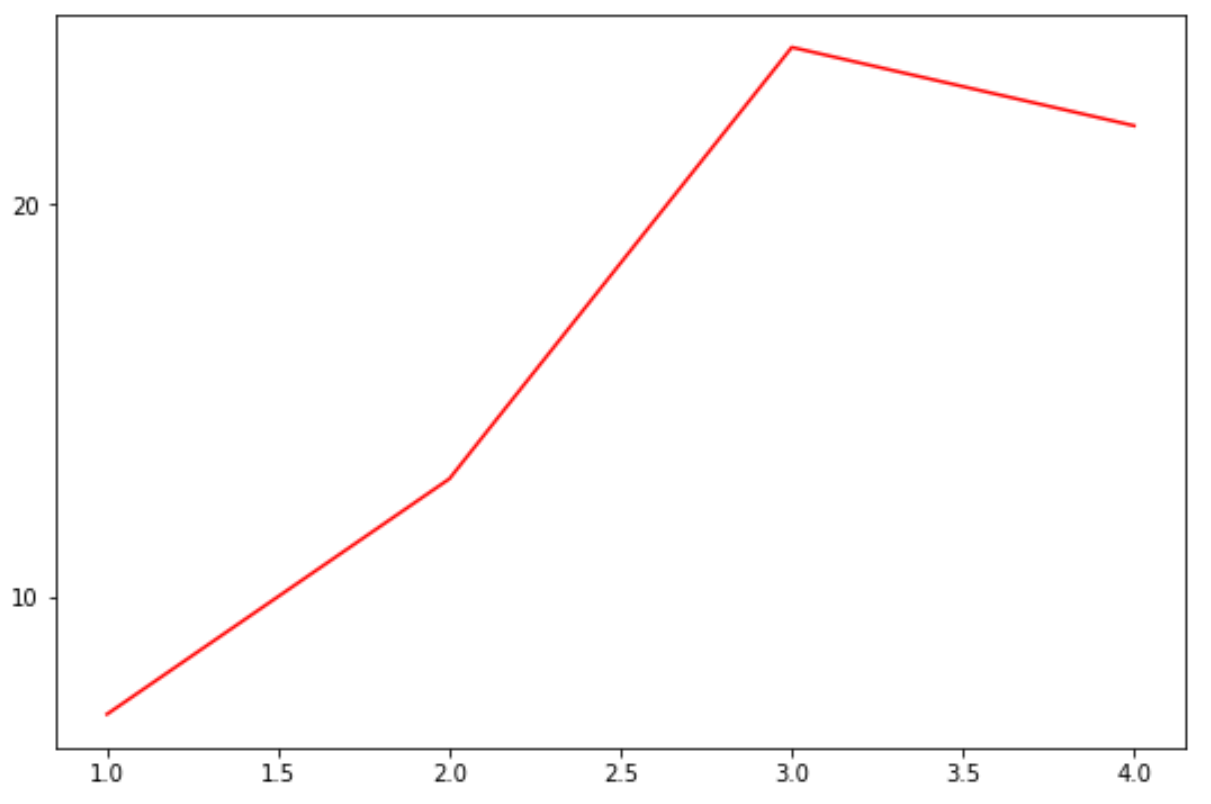
例 3: Y 軸上の目盛りの数のみを指定する
次のコードは、Y 軸のみのティック数を指定する方法を示しています。
 import matplotlib. pyplot as plt

#define data
x = [1, 2, 3, 4]
y = [7, 13, 24, 22]

#createplot
plt. plot (x,y,color=' red ')

#specify number of ticks on y-axis
plt. locator_params (axis=' y ', nbins= 2 )

追加リソース
Matplotlib プロットから目盛りを削除する方法
Matplotlib でチェックマーク ラベルのフォント サイズを設定する方法
MatplotlibでX軸の値を設定する方法
Matplotlib で軸範囲を設定する方法