Matplotlib で時系列をプロットする方法 (例付き)
次の構文を使用して、Matplotlib で時系列をプロットできます。
 import matplotlib. pyplot as plt

plt. plot (df. x , df. y )
これは、変数 x がdatetime.datetime()クラスに属していることを前提としています。
次の例は、この構文を使用して Python で時系列データをプロットする方法を示しています。
例 1: Matplotlib で基本的な時系列をプロットする
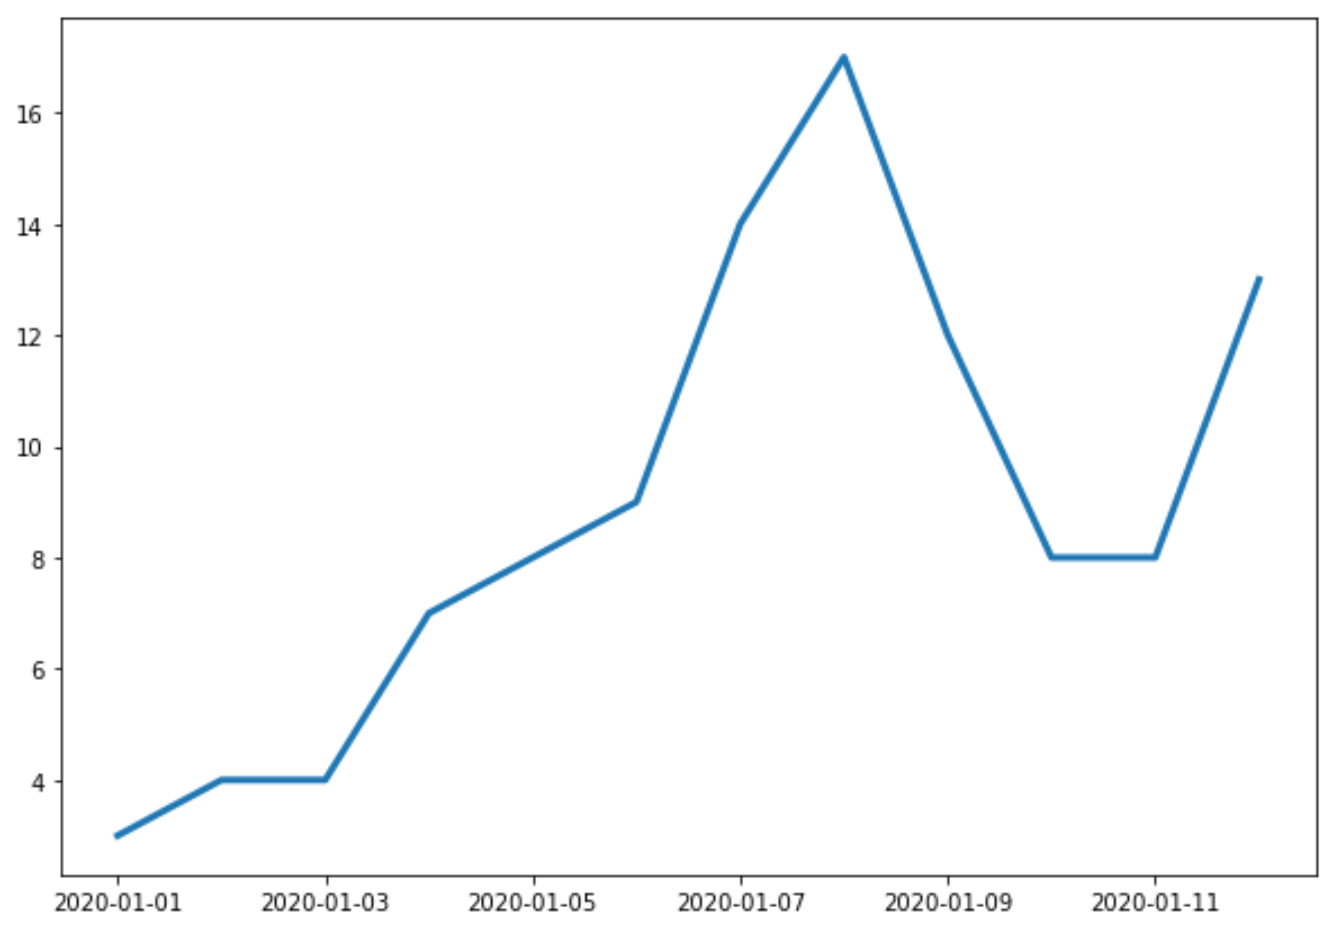
次のコードは、連続 12 日間の企業の総売上高を示す時系列を Matplotlib でプロットする方法を示しています。
 import matplotlib. pyplot as plt
import datetime
import numpy as np
import pandas as pd

#define data
df = pd. DataFrame ({' date ': np. array ([datetime. datetime (2020, 1, i+1)
for i in range(12)]),
                   ' sales ': [3, 4, 4, 7, 8, 9, 14, 17, 12, 8, 8, 13]})

#plot time series
plt. plot (df. date , df. sales , linewidth= 3 )

X 軸は日付を示し、Y 軸は各日付の合計売上を示します。
例 2: タイトルと軸のラベルをカスタマイズする
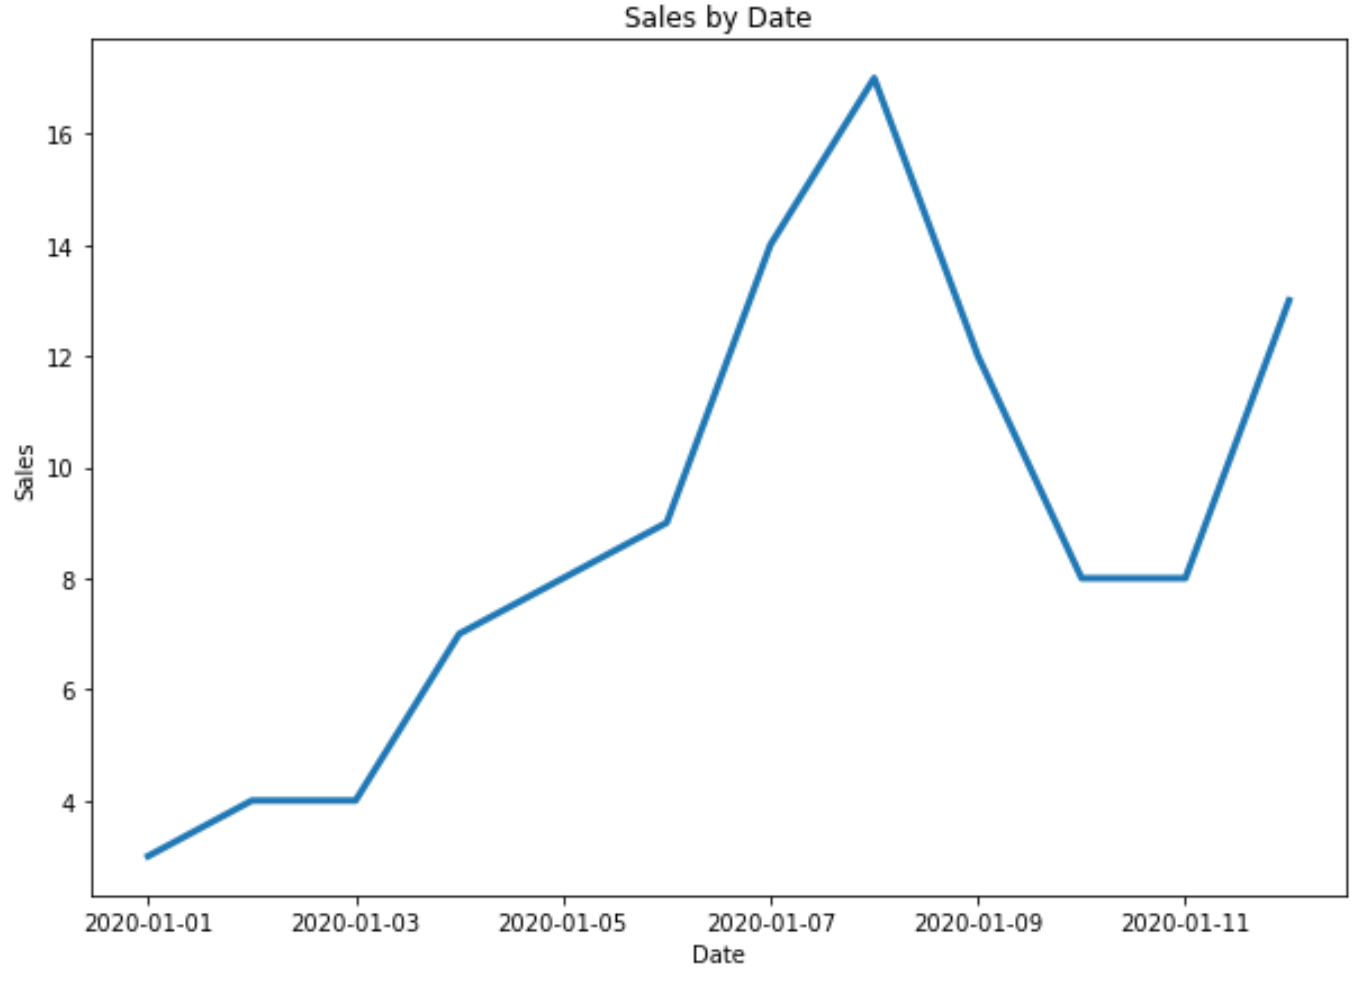
次のコードを使用して、プロットにタイトルと軸ラベルを追加できます。
 import matplotlib. pyplot as plt
import datetime
import numpy as np
import pandas as pd

#define data
df = pd. DataFrame ({' date ': np. array ([datetime. datetime (2020, 1, i+1)
for i in range(12)]),
                   ' sales ': [3, 4, 4, 7, 8, 9, 14, 17, 12, 8, 8, 13]})

#plot time series
plt. plot (df. date , df. sales , linewidth= 3 )

#add title and axis labels
plt. title (' Sales by Date ')
plt. xlabel (' Date ')
plt. ylabel (' Sales ')

例 3: Matplotlib で複数の時系列をプロットする
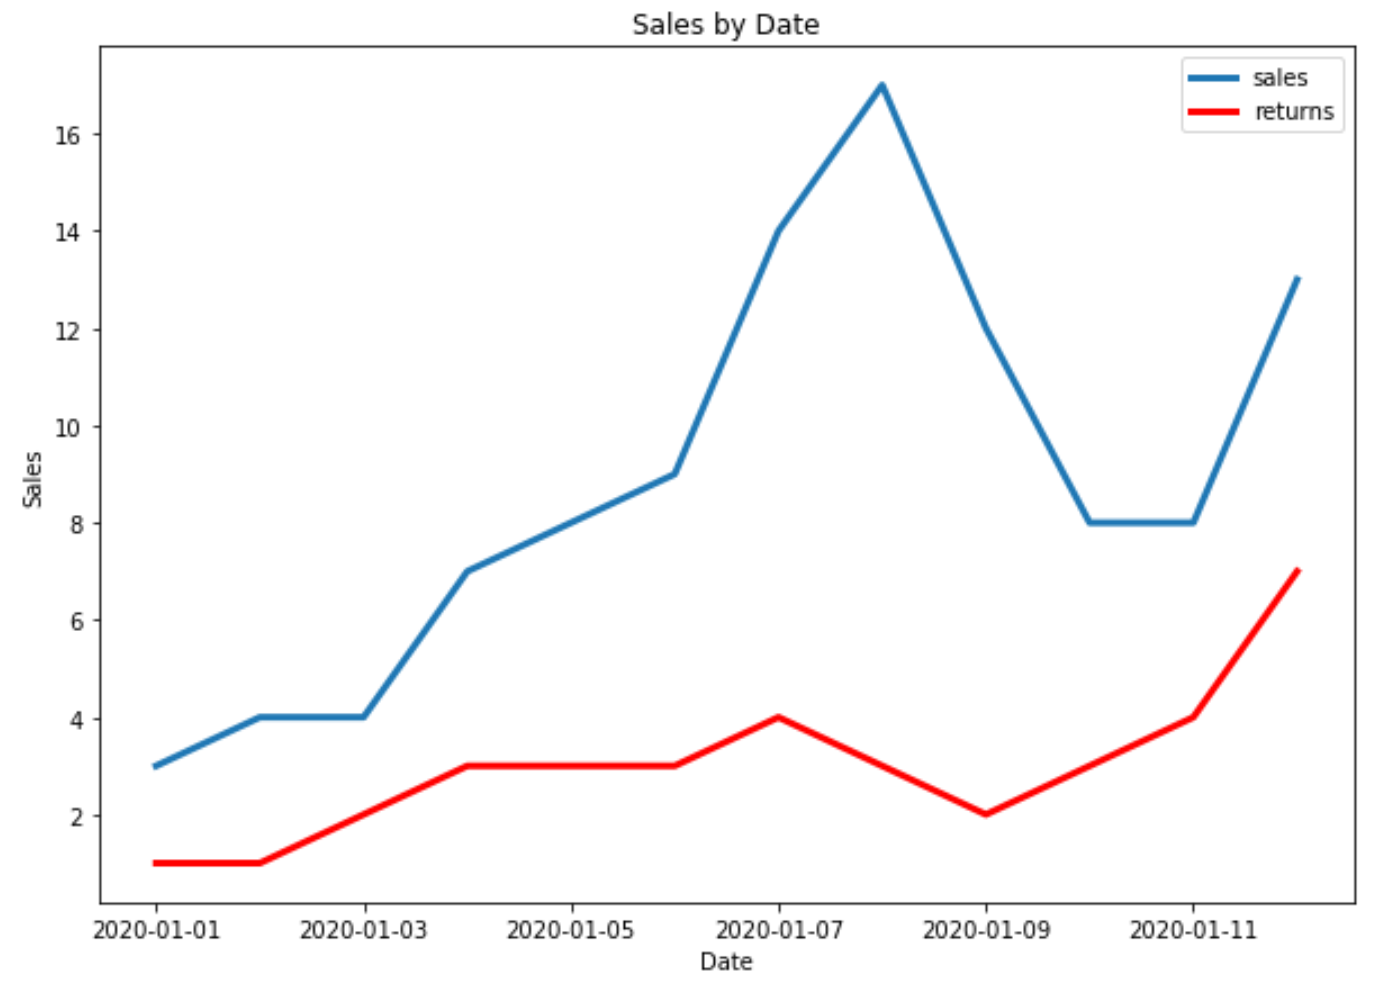
次のコードは、Matplotlib で 1 つのプロットに複数の時系列をプロットする方法を示しています。
 import matplotlib. pyplot as plt
import datetime
import numpy as np
import pandas as pd

#define data
df = pd. DataFrame ({' date ': np. array ([datetime. datetime (2020, 1, i+1)
                                     for i in range(12)]),
                   ' sales ': [3, 4, 4, 7, 8, 9, 14, 17, 12, 8, 8, 13]})

df2 = pd. DataFrame ({' date ': np. array ([datetime. datetime (2020, 1, i+1)
                                      for i in range(12)]),
                   ' returns ': [1, 1, 2, 3, 3, 3, 4, 3, 2, 3, 4, 7]})

#plot both time series
plt. plot ( df.date , df.sales , label=' sales ', linewidth= 3 )
plt. plot ( df2.date , df2.returns , color=' red ', label=' returns ', linewidth= 3 )

#add title and axis labels
plt. title (' Sales by Date ')
plt. xlabel (' Date ')
plt. ylabel (' Sales ')

#add legend
plt. legend ()

#displayplot
plt. show ()
