2 つの y 軸を持つ matplotlib プロットを作成する方法
2 つの y 軸を持つ Matplotlib プロットを作成する最も簡単な方法は、 twinx()関数を使用することです。
次の例は、この関数を実際に使用する方法を示しています。
例: 2 つの Y 軸を持つ Matplotlib プロットを作成する
次の 2 つのパンダ DataFrame があると仮定します。
 import pandas as pd

#createDataFrames
df1 = pd. DataFrame ({' year ': [1, 2, 3, 4, 5, 6, 7, 8, 9, 10],
                    ' sales ': [14, 16, 19, 22, 24, 25, 24, 24, 27, 30]})

df2 = pd. DataFrame ({' year ': [1, 2, 3, 4, 5, 6, 7, 8, 9, 10],
                    ' leads ': [4, 4, 4, 5, 4, 5, 7, 8, 5, 3]})
両方の DataFrame は 1 ~ 10 の範囲の「年」変数を共有しますが、最初の DataFrame は毎年の総売上高を表示し、2 番目の DataFrame は毎年の合計リードを表示します。
次のコードを使用して、2 つの Y 軸を持つグラフに売上と見込み客を表示する Matplotlib プロットを作成できます。
 import matplotlib. pyplot as plt

#define colors to use
col1 = ' steelblue '
col2 = ' red '

#define subplots
fig,ax = plt. subplots ()

#add first line to plot
ax. plot (df1. year , df1. sales , color=col1)

#add x-axis label
ax. set_xlabel (' Year ', fontsize= 14 )

#add y-axis label
ax. set_ylabel (' Sales ', color=col1, fontsize= 16 )

#define second y-axis that shares x-axis with current plot
ax2 = ax. twinx ()

#add second line to plot
ax2. plot (df2. year , df2. leads , color=col2)

#add second y-axis label
ax2. set_ylabel (' Leads ', color=col2, fontsize= 16 )

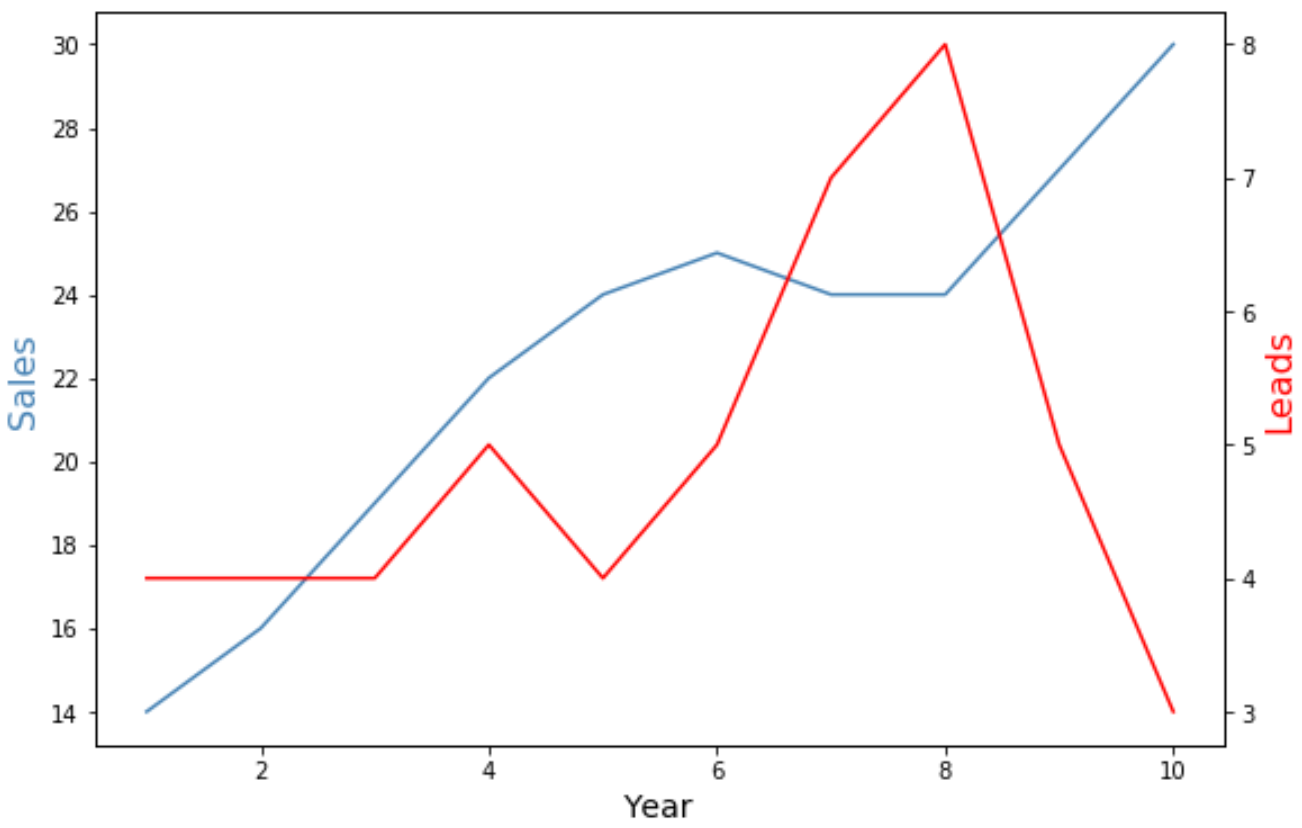
グラフの左側の Y 軸は年間の総売上高を示し、グラフの右側の Y 軸は年間の総リード数を示します。
グラフの青線は年間総売上高を表し、赤線は年間総リードを表します。
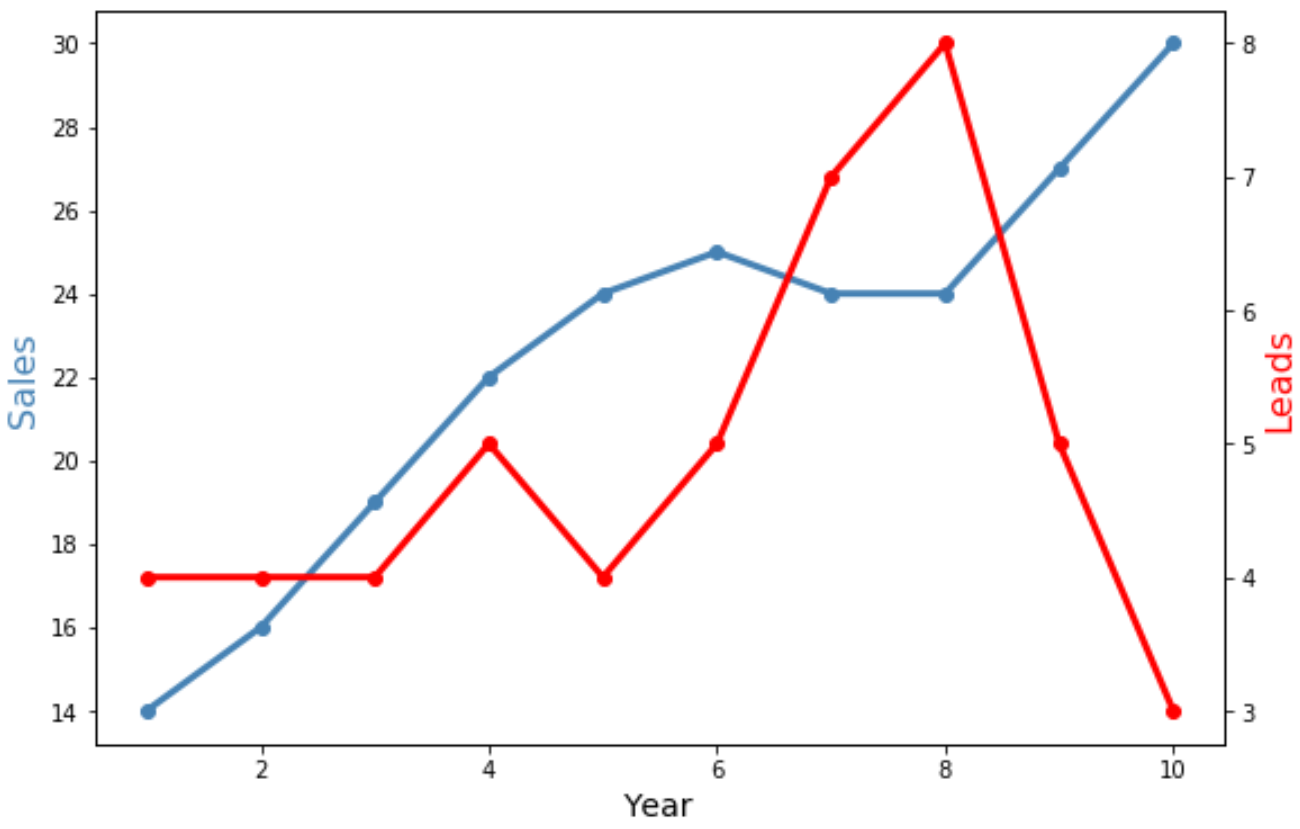
マーカーと線の幅の引数を自由に使用して、グラフ内の線の外観を変更できます。
 import matplotlib. pyplot as plt

#define colors to use
col1 = ' steelblue '
col2 = ' red '

#define subplots
fig,ax = plt. subplots ()

#add first line to plot
ax. plot (df1. year , df1. sales , color=col1, marker=' o ', linewidth= 3 )

#add x-axis label
ax. set_xlabel (' Year ', fontsize= 14 )

#add y-axis label
ax. set_ylabel (' Sales ', color=col1, fontsize= 16 )

#define second y-axis that shares x-axis with current plot
ax2 = ax. twinx ()

#add second line to plot
ax2. plot (df2. year , df2. leads , color=col2, marker=' o ', linewidth= 3 )

#add second y-axis label
ax2. set_ylabel (' Leads ', color=col2, fontsize= 16 )

両方の線の幅が広くなり、個々のデータ ポイントを表示するための「o」マーカーが含まれることに注意してください。
追加リソース
次のチュートリアルでは、Matplotlib で他の一般的な操作を実行する方法を説明します。
Matplotlib で軸ラベルの位置を調整する方法
Matplotlib で軸範囲を設定する方法
MatplotlibでX軸の値を設定する方法