Python で matplotlib を使用してローソク足チャートを作成する方法
ローソク足チャートは、時間の経過に伴う有価証券の価格変動を表示する財務チャートの一種です。
次の例は、Python でMatplotlib視覚化ライブラリを使用してローソク足チャートを作成する方法を示しています。
例: Python でローソク足チャートを作成する
8 日間の特定の株式の始値、終値、高値、安値を示す次のパンダ データフレームがあるとします。
 import pandas as pd

#createDataFrame
prices = pd. DataFrame ({' open ': [25, 22, 21, 19, 23, 21, 25, 29],
                       ' close ': [24, 20, 17, 23, 22, 25, 29, 31],
                       ' high ': [28, 27, 29, 25, 24, 26, 31, 37],
                       ' low ': [22, 16, 14, 17, 19, 18, 22, 26]},
                       index=pd. date_range (" 2021-01-01 ", periods=8, freq=" d "))

#display DataFrame
print (prices)

            open close high low
2021-01-01 25 24 28 22
2021-01-02 22 20 27 16
2021-01-03 21 17 29 14
2021-01-04 19 23 25 17
2021-01-05 23 22 24 19
2021-01-06 21 25 26 18
2021-01-07 25 29 31 22
2021-01-08 29 31 37 26
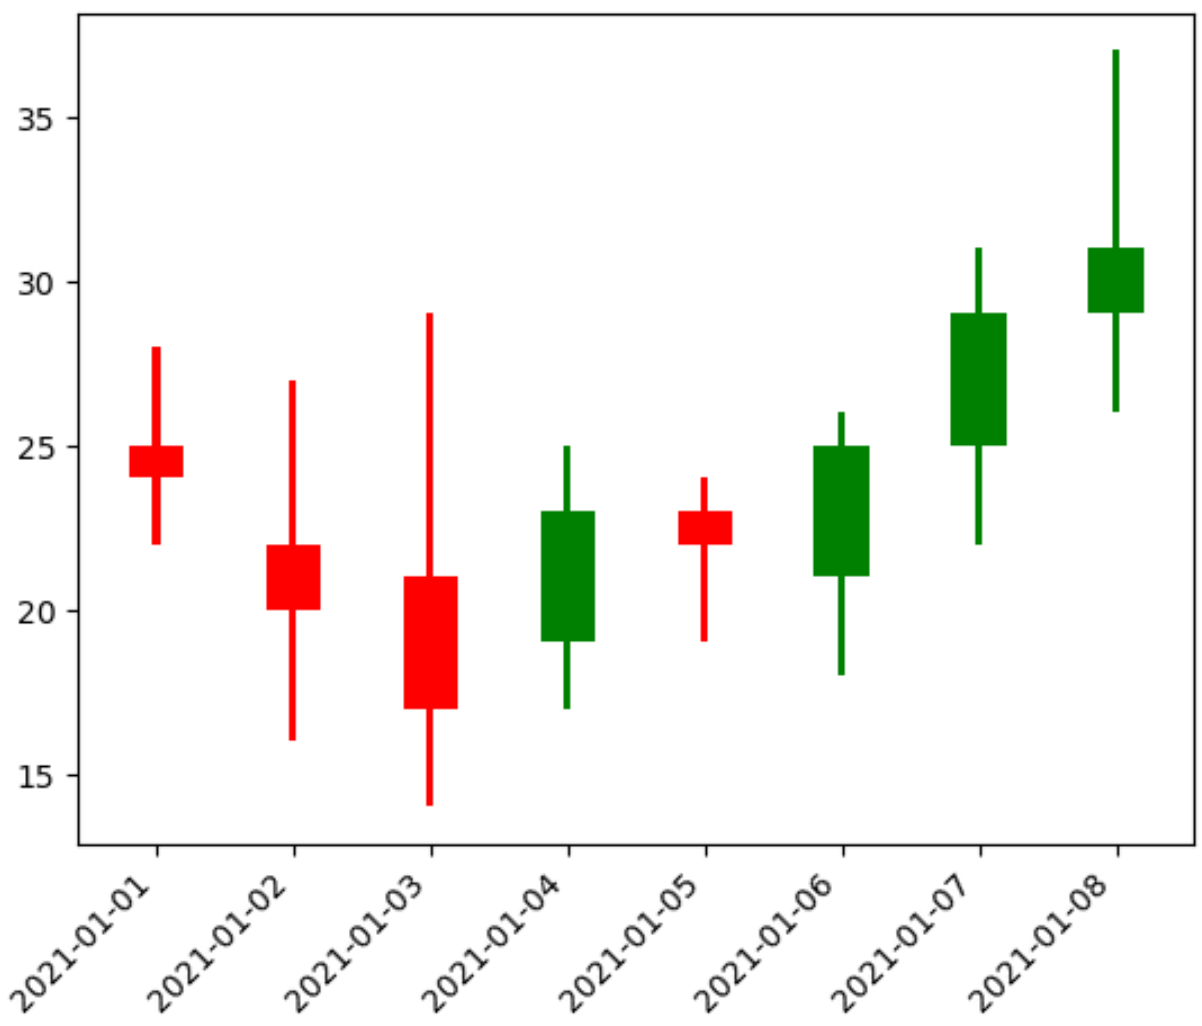
次のコードを使用してローソク足チャートを作成し、この 8 日間のこの株式の価格変動を視覚化できます。
 import matplotlib. pyplot as plt

#create figure
plt. figure ()

#define width of candlestick elements
width = .4
width2 = .05

#define up and down prices
up = prices[prices. close >=prices. open ]
down = prices[prices. close <prices. open ]

#define colors to use
col1 = ' green '
col2 = ' red '

#plot up prices
plt. bar (up. index , up. close -up. open , width, bottom=up. open , color=col1)
plt. bar (up. index ,up. high -up. close ,width2,bottom=up. close ,color=col1)
plt. bar (up. index , up. low -up. open , width2, bottom=up. open , color=col1)

#plot down prices
plt. bar (down. index , down. close -down. open , width, bottom=down. open , color=col2)
plt. bar (down. index , down. high -down. open , width2, bottom=down. open , color=col2)
plt. bar (down. index ,down. low -down. close ,width2,bottom=down. close ,color=col2)

#rotate x-axis tick labels
plt. xticks (rotation= 45 , ha=' right ')

#display candlestick chart
plt. show ()

各ローソク足は、特定の日の証券価格の変化を表します。ローソク足の色は、価格が前日と比較して高く終了した (緑) か、安く終了した (赤) かを示します。
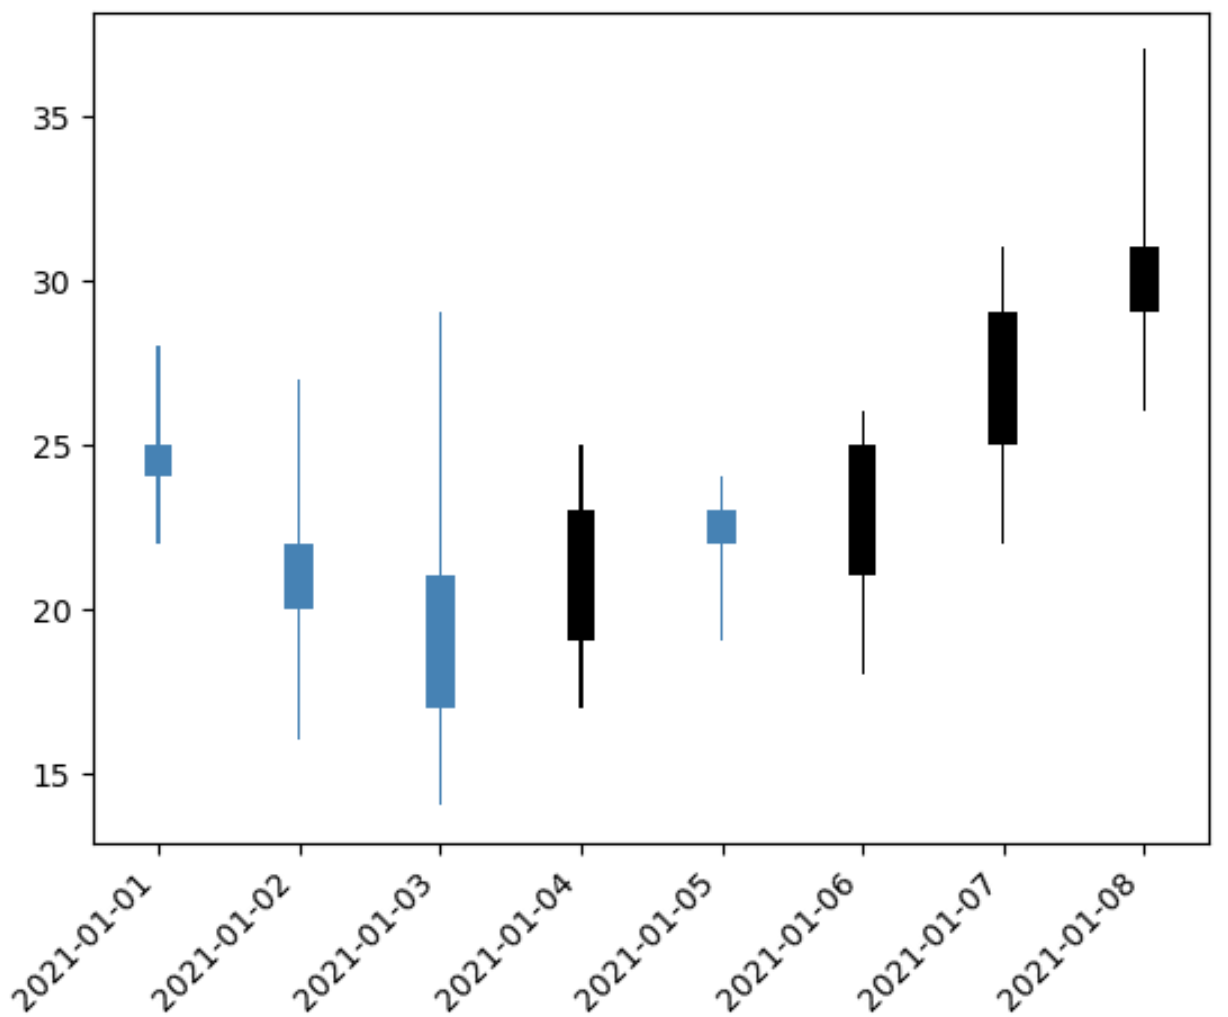
ローソク足の幅や使用する色を自由に変更して、チャートを思い通りに表示できます。
たとえば、ろうそくの火をさらに薄くし、異なる色を使用して「最高」日と「最低」日を表すことができます。
 import matplotlib. pyplot as plt

#create figure
plt. figure ()

#define width of candlestick elements
width = .2
width2 = .02

#define up and down prices
up = prices[prices. close >=prices. open ]
down = prices[prices. close <prices. open ]

#define colors to use
col1 = ' black '
col2 = ' steelblue '

#plot up prices
plt. bar (up. index , up. close -up. open , width, bottom=up. open , color=col1)
plt. bar (up. index ,up. high -up. close ,width2,bottom=up. close ,color=col1)
plt. bar (up. index , up. low -up. open , width2, bottom=up. open , color=col1)

#plot down prices
plt. bar (down. index , down. close -down. open , width, bottom=down. open , color=col2)
plt. bar (down. index , down. high -down. open , width2, bottom=down. open , color=col2)
plt. bar (down. index ,down. low -down. close ,width2,bottom=down. close ,color=col2)

#rotate x-axis tick labels
plt. xticks (rotation= 45 , ha=' right ')

#display candlestick chart
plt. show ()

追加リソース
次のチュートリアルでは、Python で他の一般的なグラフを作成する方法を説明します。
単一の Figure 上に複数の Matplotlib プロットを作成する方法
Python でデータのリストからヒストグラムをプロットする方法
Python でグループごとに箱ひげ図を作成する方法